Fig. 5.
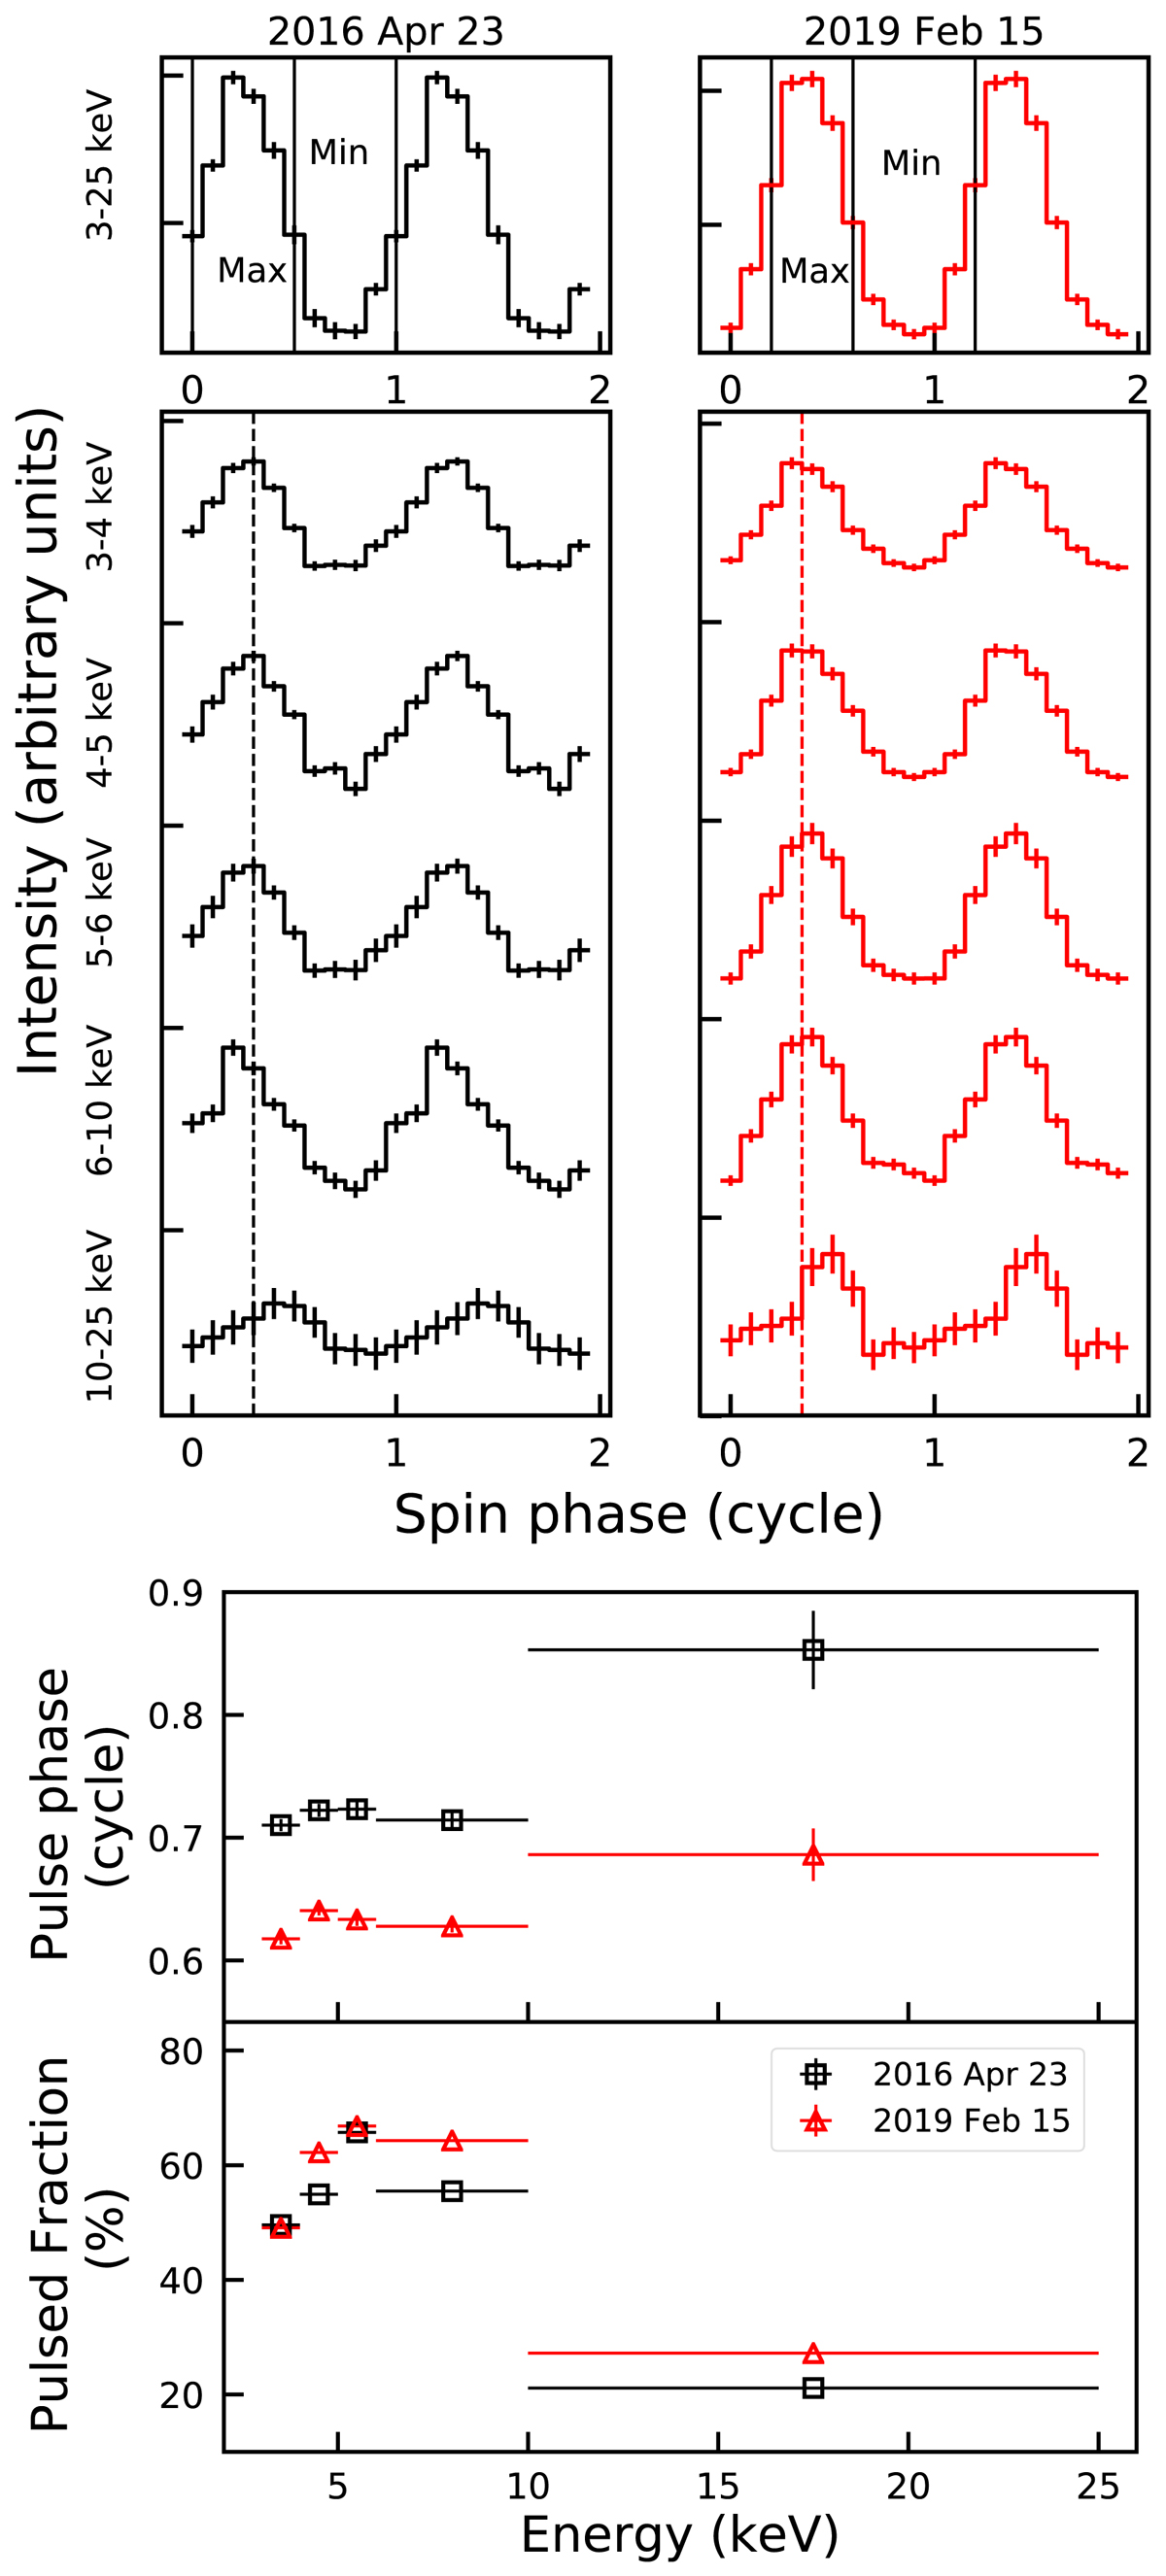
Top: background-subtracted pulse profiles of 1E 1547.0–5408 extracted over the 3–25 keV energy range from the combined NuSTAR FPMA and FPMB data sets, and separately for both observations. The vertical black solid lines mark the phase intervals adopted to extract the phase-resolved spectra. Middle: pulse profiles extracted in selected energy ranges. The profiles have been shifted along the vertical axis for plotting purpose. The vertical dashed lines mark the phase of the pulse peak in the soft X-ray energy bands (up to 10 keV). All pulse profiles in the top and middle panels are sampled in 10 phase bins, and two phase cycles are shown. For display purposes, the 2016 pulse profiles have been phase-aligned to the 2019 ones. Bottom: pulse phase (top) and pulsed fraction (bottom) as a function of energy at both epochs.
Current usage metrics show cumulative count of Article Views (full-text article views including HTML views, PDF and ePub downloads, according to the available data) and Abstracts Views on Vision4Press platform.
Data correspond to usage on the plateform after 2015. The current usage metrics is available 48-96 hours after online publication and is updated daily on week days.
Initial download of the metrics may take a while.