Fig. 13.
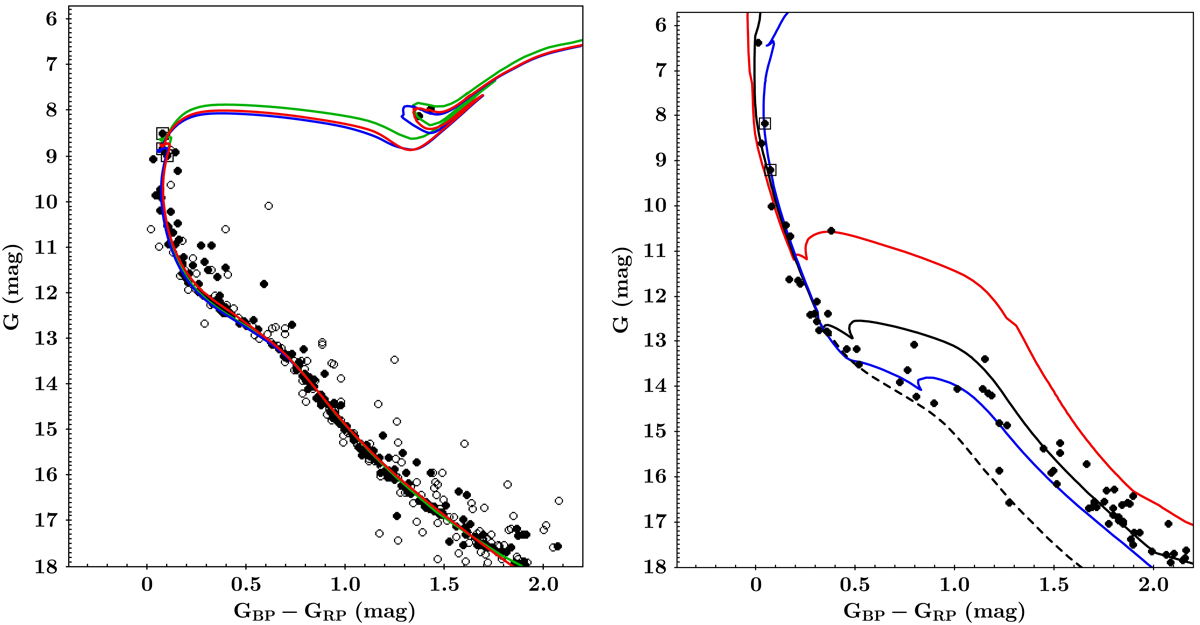
Color–magnitude diagram of NGC 2546A (left) and NGC 2546B (right). In both cases only stars with proper motion and parallax consistent with the cluster have been plotted. In the left panel filled (open) symbols are stars with angular distance to the cluster centre in the range 0.0–0.4 deg (0.4–1.0 deg). Spectroscopic binaries are marked with open squares. Three isochrones for log τ = 8.25 are shown: PARSEC (green), MIST without rotation (blue), and MIST with rotation (red). In the right panel MIST isochrones (with rotation) for log τ = 6.0 (red), 6.7 (black), and 7.0 (blue) are plotted. Dashed line is the zero-age main-sequence.
Current usage metrics show cumulative count of Article Views (full-text article views including HTML views, PDF and ePub downloads, according to the available data) and Abstracts Views on Vision4Press platform.
Data correspond to usage on the plateform after 2015. The current usage metrics is available 48-96 hours after online publication and is updated daily on week days.
Initial download of the metrics may take a while.