Fig. 1.
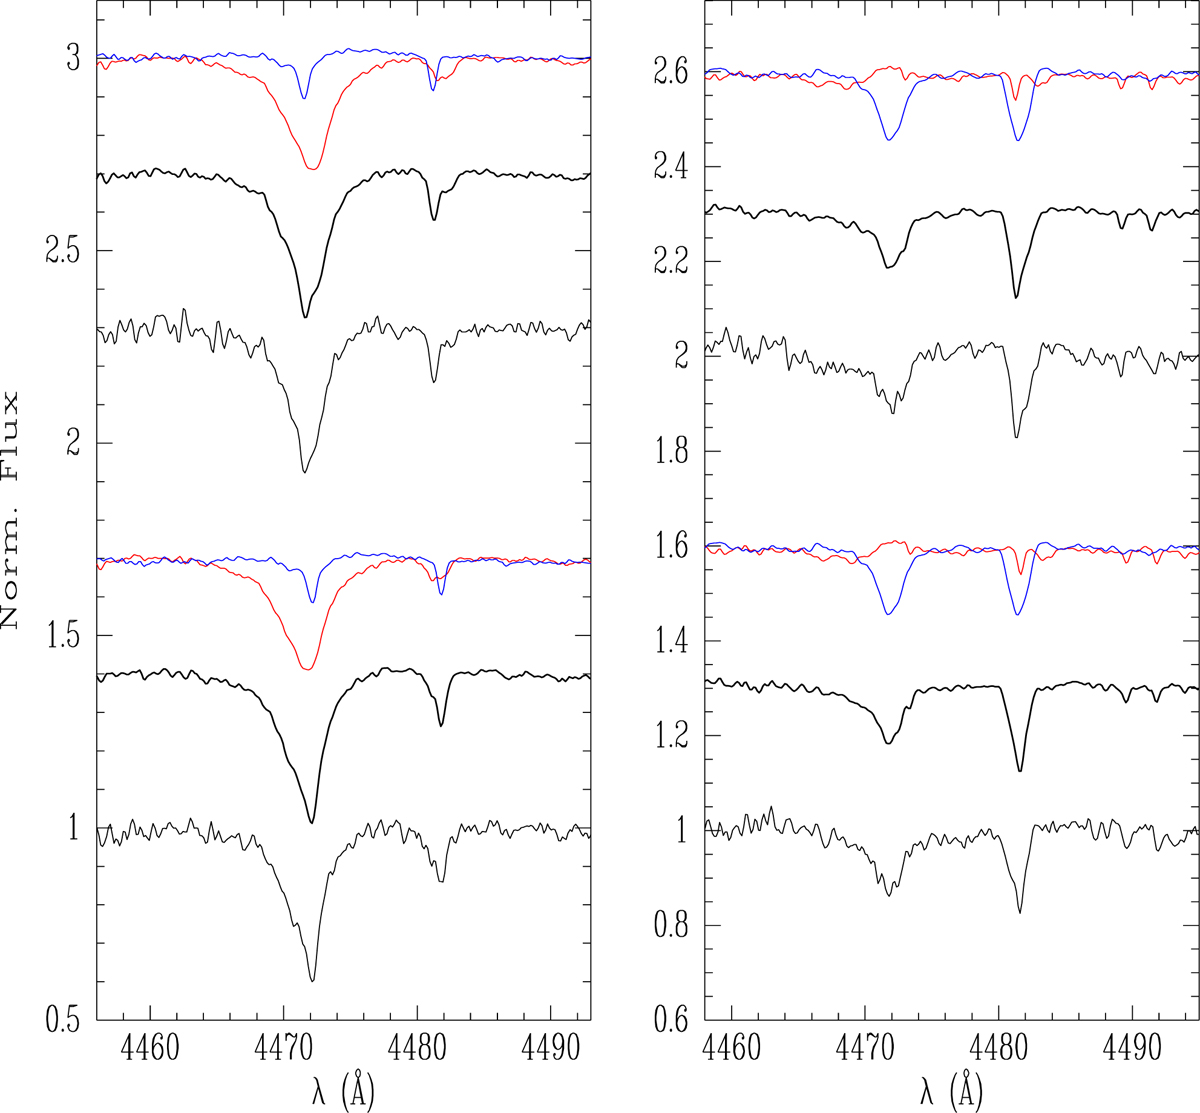
Spectral separation of the SB2s 30 (right panel) and 257 (left panel). Two observed spectra taken at different orbital phases are plotted for each star. The reconstructed spectra of the two stellar component are shown in blue and red. Below, in thin black line, is the spectrum modeled combining the two spectra of the components, and below it, in heavy black line, the observed spectrum.
Current usage metrics show cumulative count of Article Views (full-text article views including HTML views, PDF and ePub downloads, according to the available data) and Abstracts Views on Vision4Press platform.
Data correspond to usage on the plateform after 2015. The current usage metrics is available 48-96 hours after online publication and is updated daily on week days.
Initial download of the metrics may take a while.