Free Access
Fig. 5.
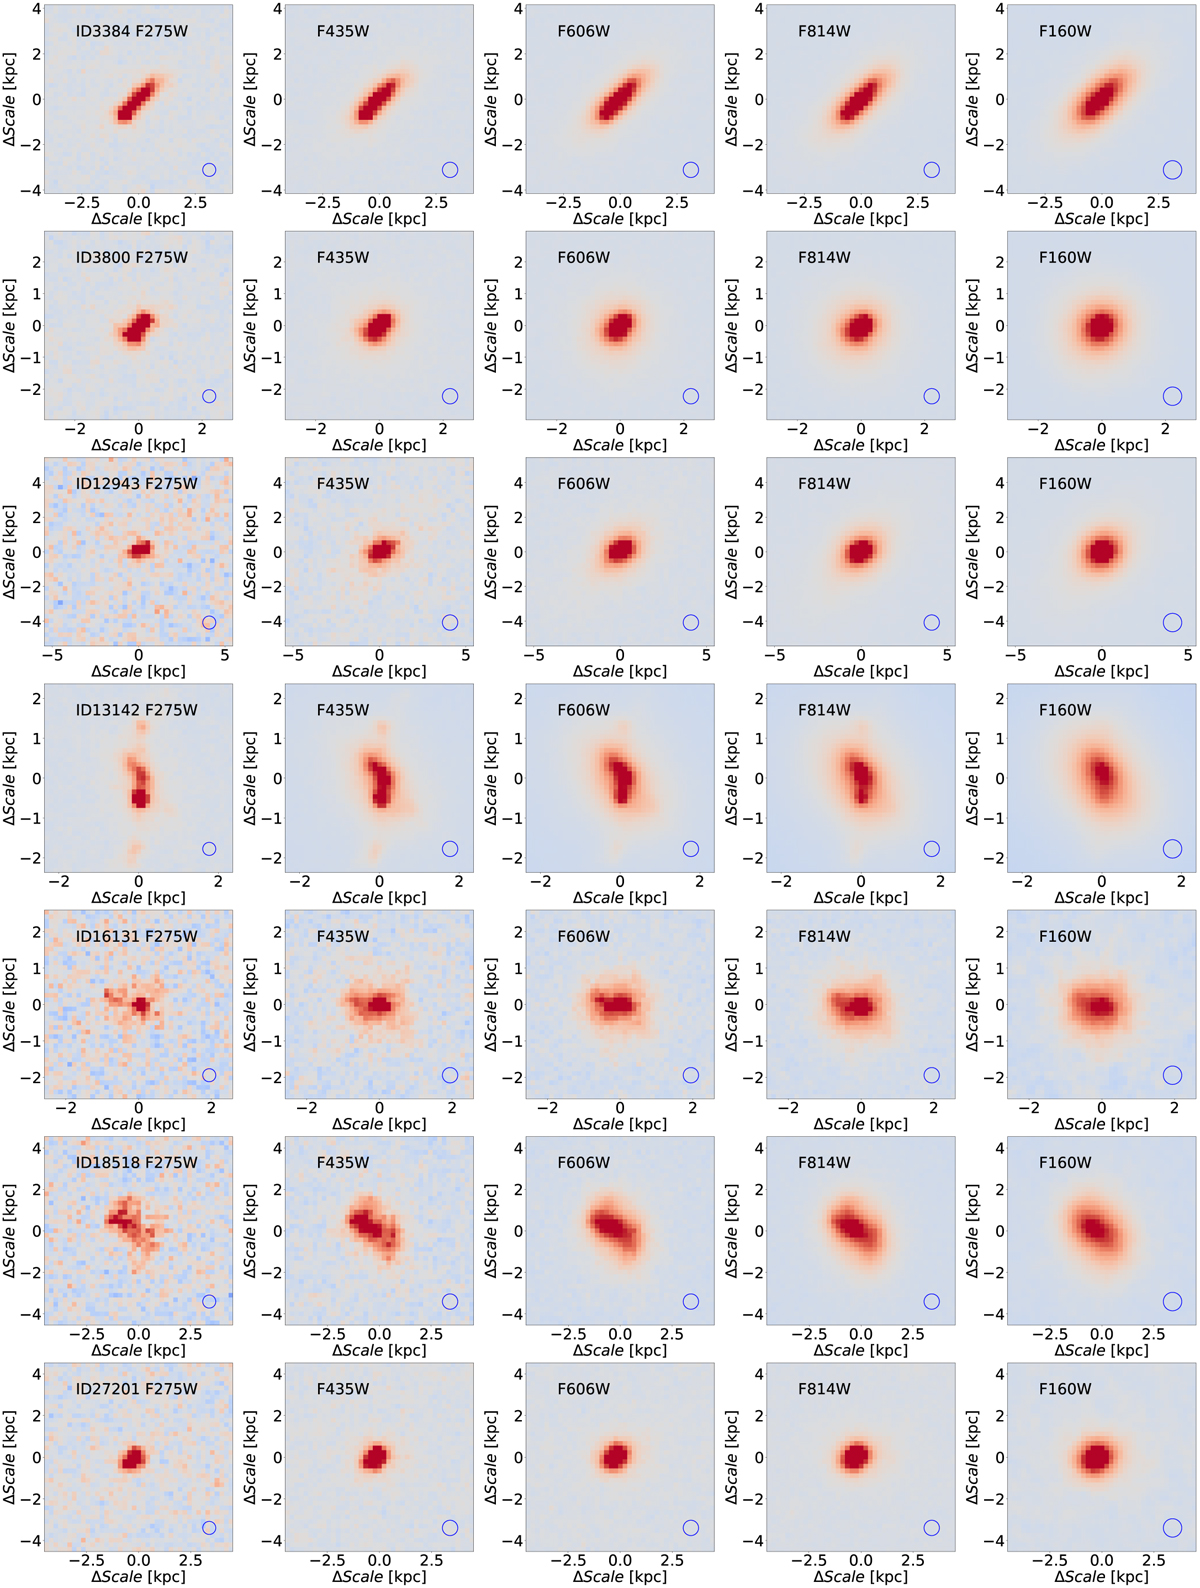
Examples of UV compact galaxy sample. Each line shows one target in several bands. We denote the CANDELS ID and bands name in the stamp images. The PSF of each image is shown by the blue circle. The image scale has been transferred to the unit of kpc based on the spec-z of each target.
Current usage metrics show cumulative count of Article Views (full-text article views including HTML views, PDF and ePub downloads, according to the available data) and Abstracts Views on Vision4Press platform.
Data correspond to usage on the plateform after 2015. The current usage metrics is available 48-96 hours after online publication and is updated daily on week days.
Initial download of the metrics may take a while.