Free Access
Fig. 4.
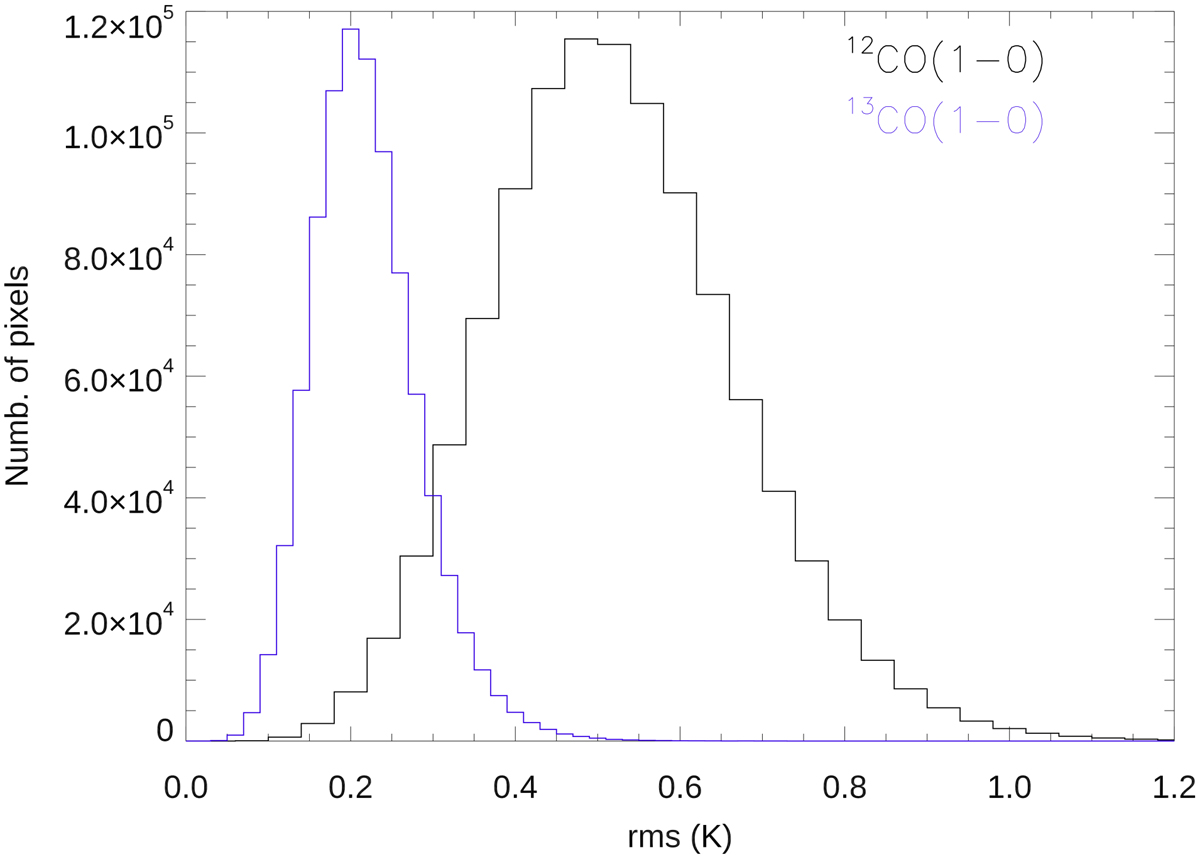
Histograms of rms of the spectra observed in FB250 in each spatial pixel of the final spectral cubes resampled in 1 km s−1 velocity channels. Blue is for 13CO (1–0) and black for 12CO (1–0).
Current usage metrics show cumulative count of Article Views (full-text article views including HTML views, PDF and ePub downloads, according to the available data) and Abstracts Views on Vision4Press platform.
Data correspond to usage on the plateform after 2015. The current usage metrics is available 48-96 hours after online publication and is updated daily on week days.
Initial download of the metrics may take a while.