Fig. 2.
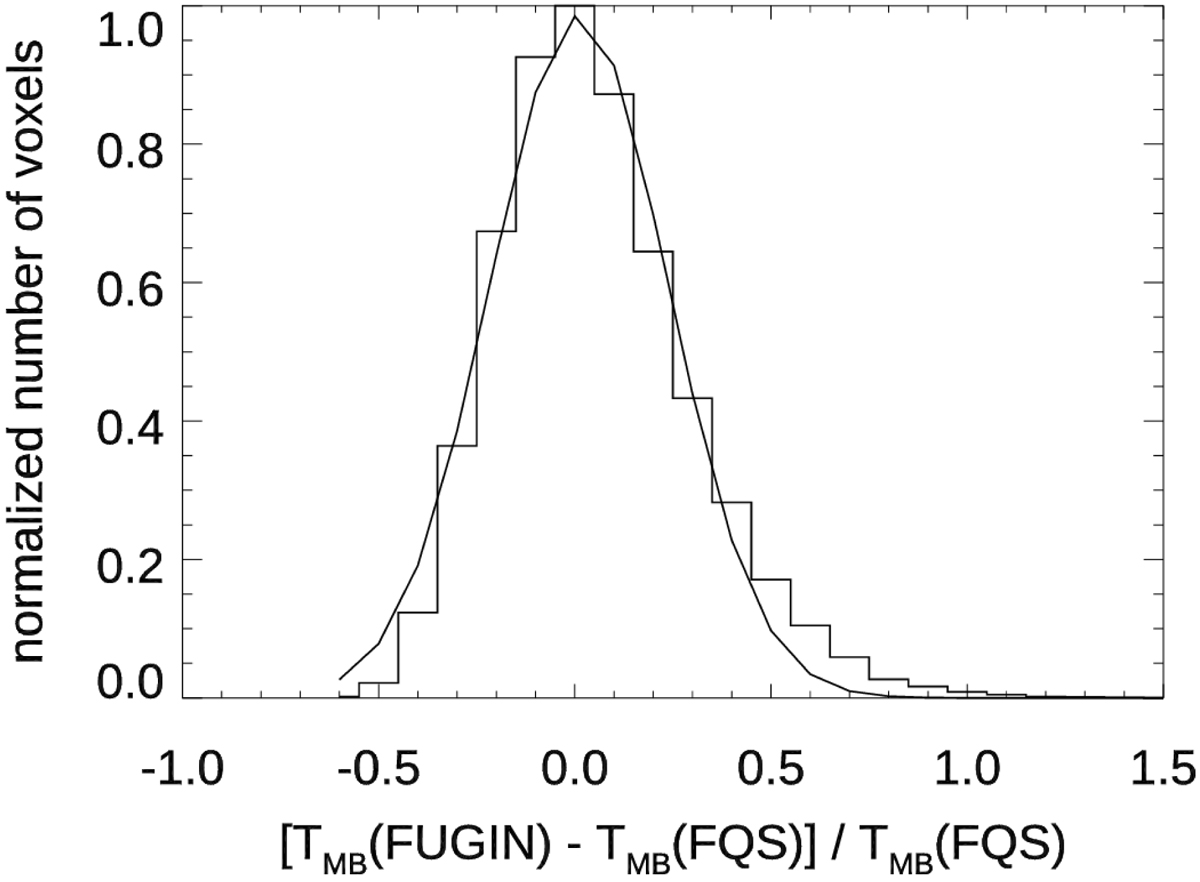
Histogram of the normalised relative difference between the main beam temperature of the 12CO (1–0) line measured in the FQS and in the FUGIN survey. The data are resampled to a common spatial resolution (55″), pixel size (1717![]() 3), and velocity channel (1 km s−1). All voxels (l, b, v) with emission above 5σ for both sets of data are considered. The continuum line shows the best-fit Gaussian distribution with peak at 0.01 and standard deviation of 0.23.
3), and velocity channel (1 km s−1). All voxels (l, b, v) with emission above 5σ for both sets of data are considered. The continuum line shows the best-fit Gaussian distribution with peak at 0.01 and standard deviation of 0.23.
Current usage metrics show cumulative count of Article Views (full-text article views including HTML views, PDF and ePub downloads, according to the available data) and Abstracts Views on Vision4Press platform.
Data correspond to usage on the plateform after 2015. The current usage metrics is available 48-96 hours after online publication and is updated daily on week days.
Initial download of the metrics may take a while.