Free Access
Fig. 17.
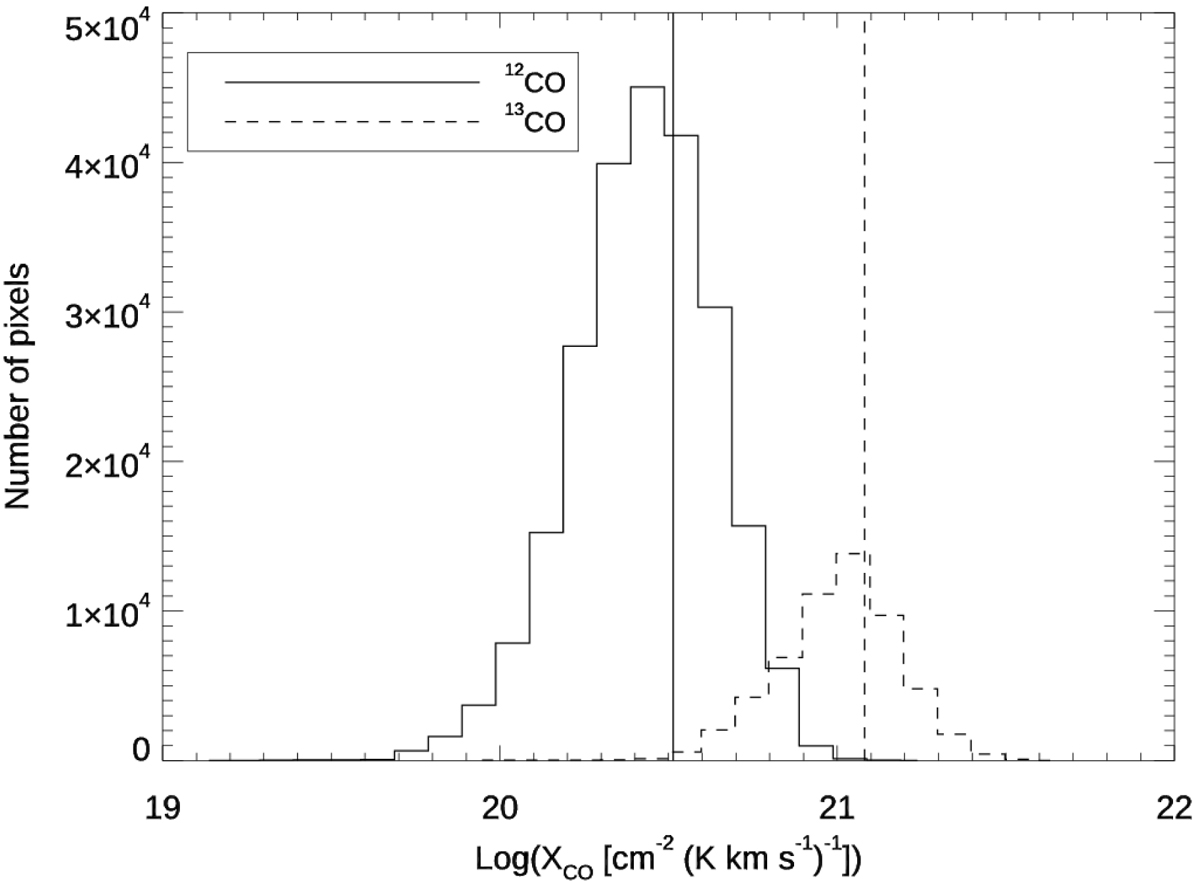
Histogram of the XCO conversion factor derived from the ratio of the Herschel H2 column density and the line intensity of 12CO (1–0) (continuum line) and 13CO (1–0) (dotted line), pixel by pixel. The vertical lines indicate the mean values of 3.3 × 1020 cm−2 (K km s−1)−1 and 1.2 × 1021 cm−2 (K km s−1)−1.
Current usage metrics show cumulative count of Article Views (full-text article views including HTML views, PDF and ePub downloads, according to the available data) and Abstracts Views on Vision4Press platform.
Data correspond to usage on the plateform after 2015. The current usage metrics is available 48-96 hours after online publication and is updated daily on week days.
Initial download of the metrics may take a while.