Free Access
Fig. 15.
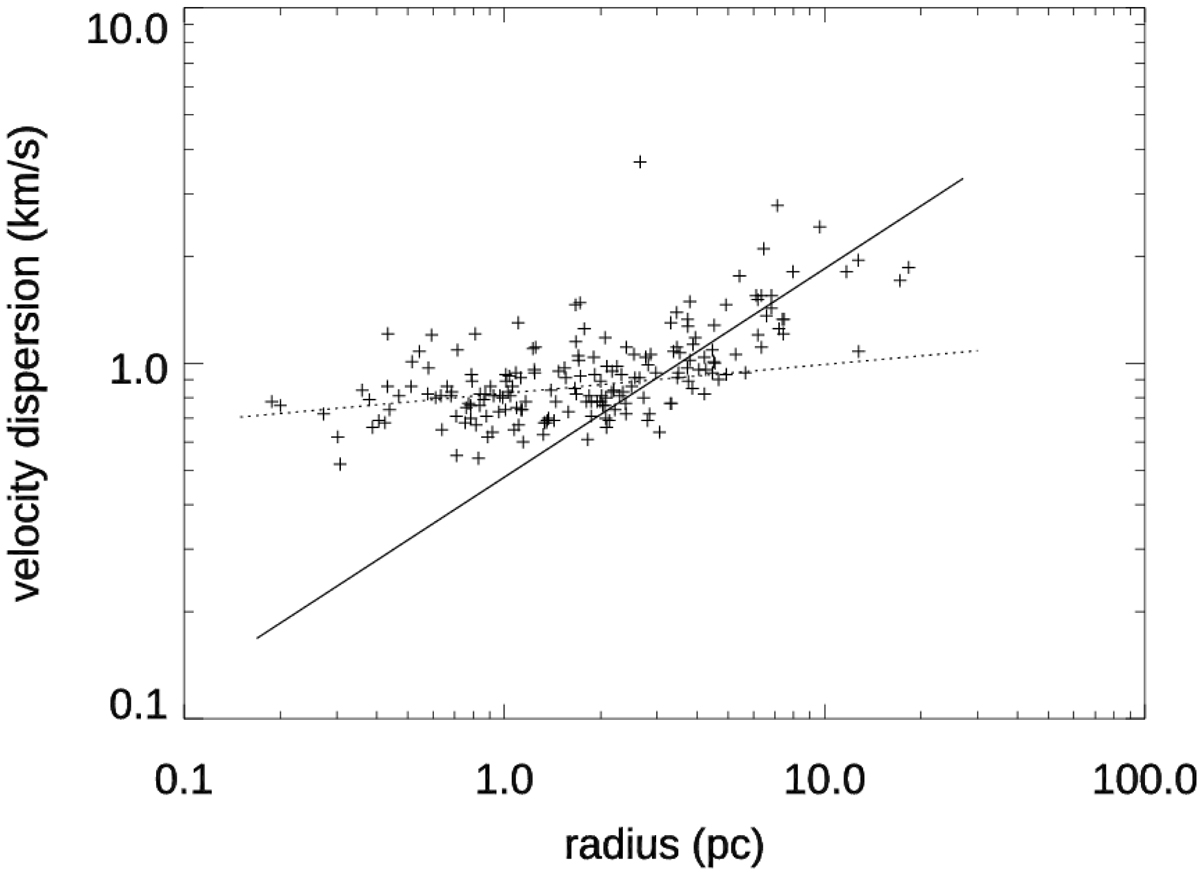
Radius–velocity dispersion plot of the MC catalogue. The lines represent the best fit of the relation σv = aRβ. For MCs with R < 2 pc (dotted line) the best-fit coefficients are: a = −0.08 and β = 0.08. For MCs with R ≥ 2 pc (solid line) the best-fit coefficients are: a = −0.32 and β = 0.59.
Current usage metrics show cumulative count of Article Views (full-text article views including HTML views, PDF and ePub downloads, according to the available data) and Abstracts Views on Vision4Press platform.
Data correspond to usage on the plateform after 2015. The current usage metrics is available 48-96 hours after online publication and is updated daily on week days.
Initial download of the metrics may take a while.