Fig. 10.
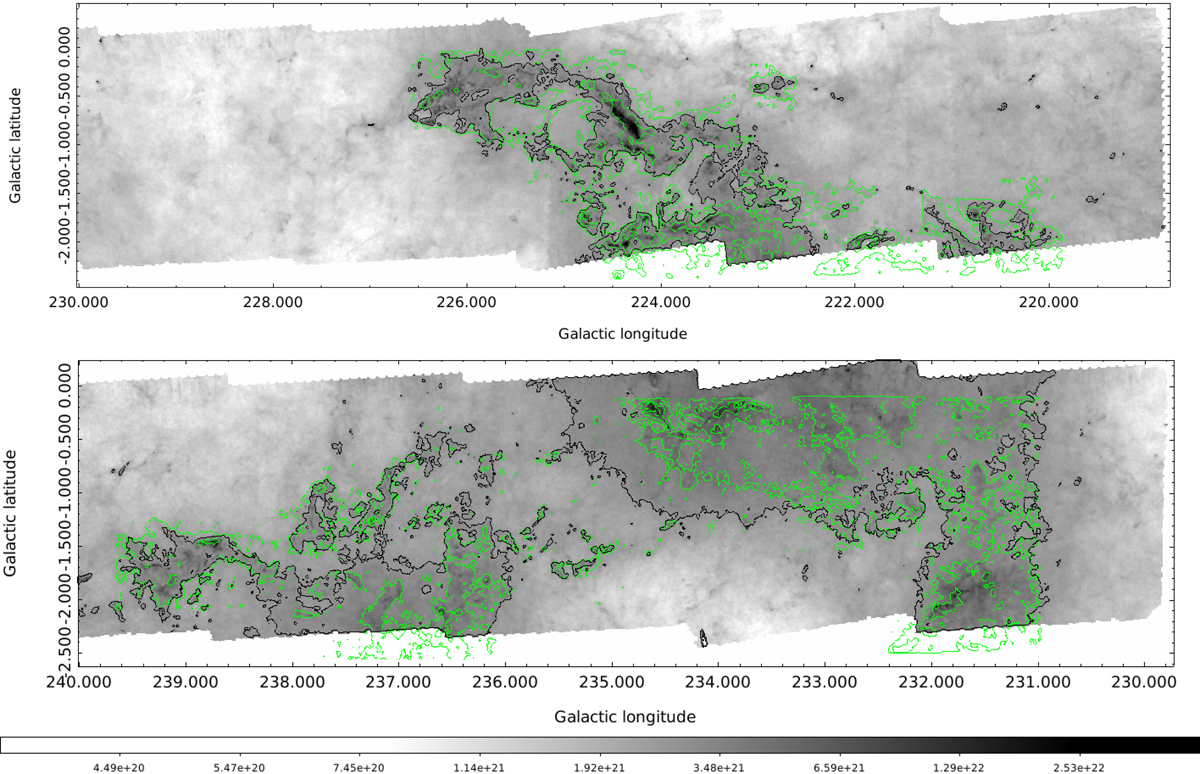
H2 column density maps (grey scale and black contour) derived from Herschel data with the 12CO (1–0) intensity maps overplotted as green contours. Top panel: range of Galactic longitude 219°–230°; the 12CO (1–0) emission is integrated over the velocity range 5–75 km s−1; green contours are at 5, 25 and 50 K km s−1. Bottom panel: range 230°–240°; the 12CO (1–0) emission is integrated over the velocity range 13–87 km s−1; green contours are at 5, 25, and 50 K km s−1. The intensity bar of the H2 column density at the bottom is in units of cm−2. The black contour corresponds to N(H2) = 2.8 × 1021 cm−2, equivalent to a visual extinction level AV = 3 mag.
Current usage metrics show cumulative count of Article Views (full-text article views including HTML views, PDF and ePub downloads, according to the available data) and Abstracts Views on Vision4Press platform.
Data correspond to usage on the plateform after 2015. The current usage metrics is available 48-96 hours after online publication and is updated daily on week days.
Initial download of the metrics may take a while.