Fig. 1.
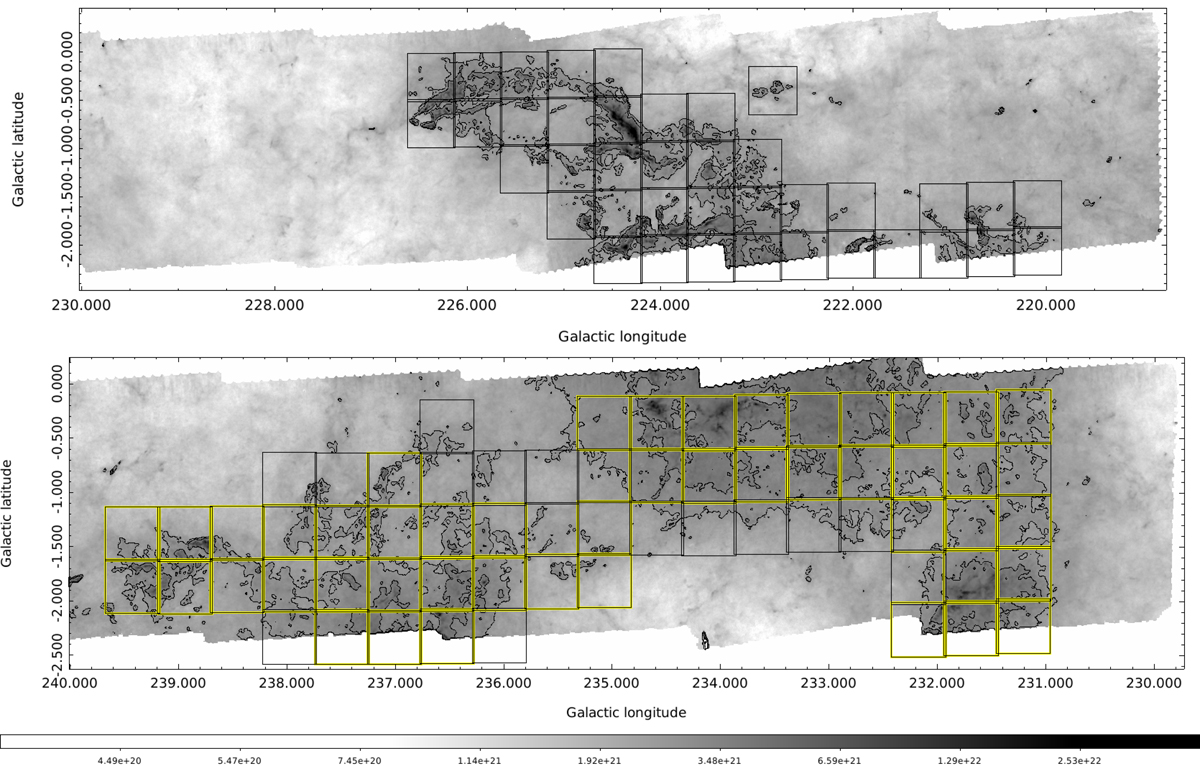
Coverage of the FQS survey with the observed 30′ × 30′ tiles (squares) overplotted on the H2 column density maps derived from Herschel data. Top panel: range of Galactic longitude 219°–230°, the coverage of 12CO (1–0) and 13CO (1–0) data (black squares) is the same. Bottom panel: range 230°–240°, where the coverage of the 13CO (1–0) data (yellow squares) is smaller than the coverage of the 12CO (1–0) data (composed by yellow squares plus black squares). The intensity bar of the H2 column density at the bottom is in units of cm−2. The two contours correspond to N(H2) = 2.8 × 1021 cm−2 and 3.8 × 1021 cm−2, equivalent to a visual extinction level of 3 and 4 mag, respectively. The sensitivity level of our observations allows detection of signal only from regions inside the contour at about 3 mag for 12CO (1–0) and at about 4 mag for 13CO (1–0).
Current usage metrics show cumulative count of Article Views (full-text article views including HTML views, PDF and ePub downloads, according to the available data) and Abstracts Views on Vision4Press platform.
Data correspond to usage on the plateform after 2015. The current usage metrics is available 48-96 hours after online publication and is updated daily on week days.
Initial download of the metrics may take a while.