Fig. 5.
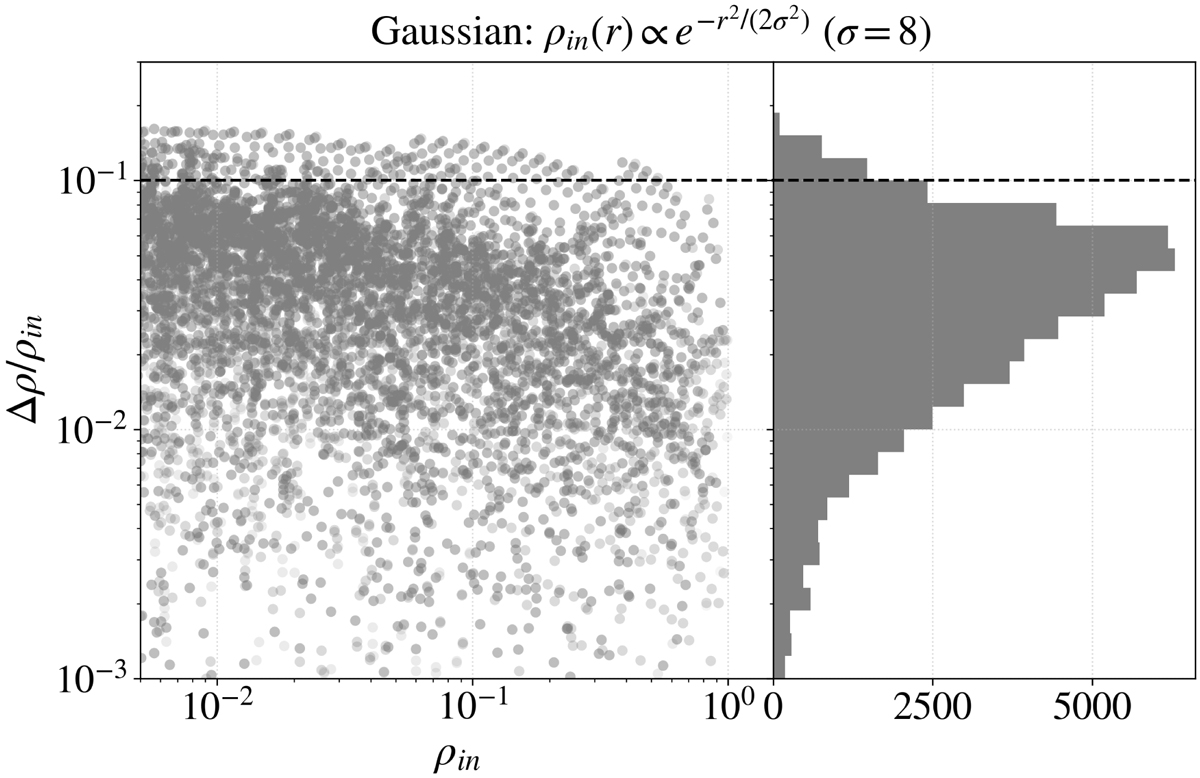
Comparison of input and reconstructed volume densities showing the relative difference as a function of the input volume density (left) and its histogram (right) for a spherically symmetric density distribution. The dashed line corresponds to the limit that was chosen to define one of the reconstruction quality parameters, fΔρ/ρin, the fraction of voxels with small relative differences in volume density.
Current usage metrics show cumulative count of Article Views (full-text article views including HTML views, PDF and ePub downloads, according to the available data) and Abstracts Views on Vision4Press platform.
Data correspond to usage on the plateform after 2015. The current usage metrics is available 48-96 hours after online publication and is updated daily on week days.
Initial download of the metrics may take a while.