Fig. 13.
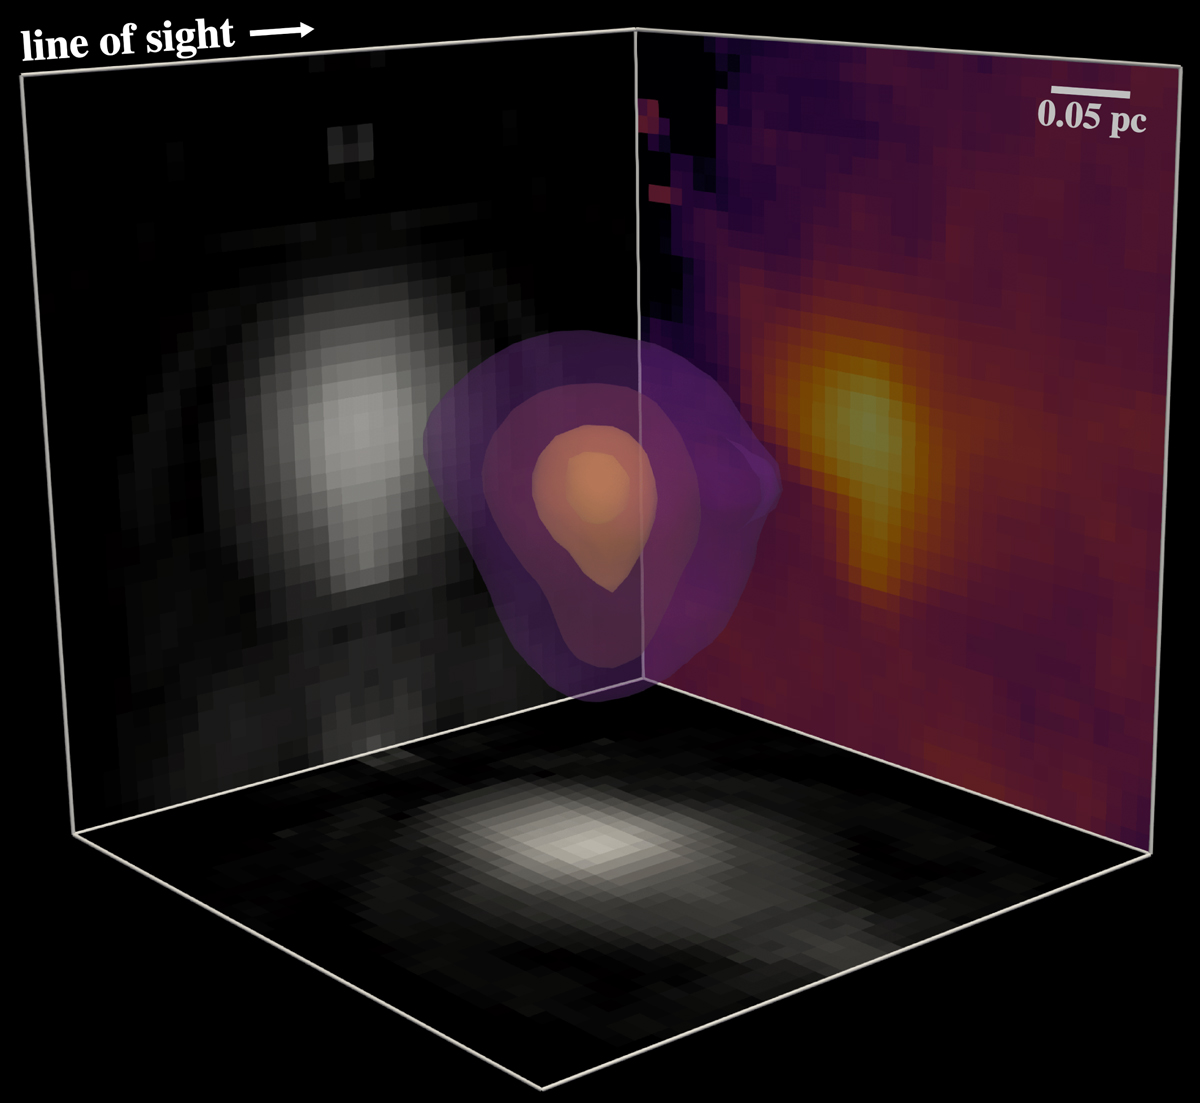
Isocontours of the reconstructed volume-density distribution of the core B68, which is smoothed for visualisation puroses. The sides of the reconstruction cube show the projection along the axis perpendicular to that side. The projection shown in colour corresponds to the projection along the line of sight and thus exhibits a similar density distribution as observations of the core.
Current usage metrics show cumulative count of Article Views (full-text article views including HTML views, PDF and ePub downloads, according to the available data) and Abstracts Views on Vision4Press platform.
Data correspond to usage on the plateform after 2015. The current usage metrics is available 48-96 hours after online publication and is updated daily on week days.
Initial download of the metrics may take a while.