Fig. 12.
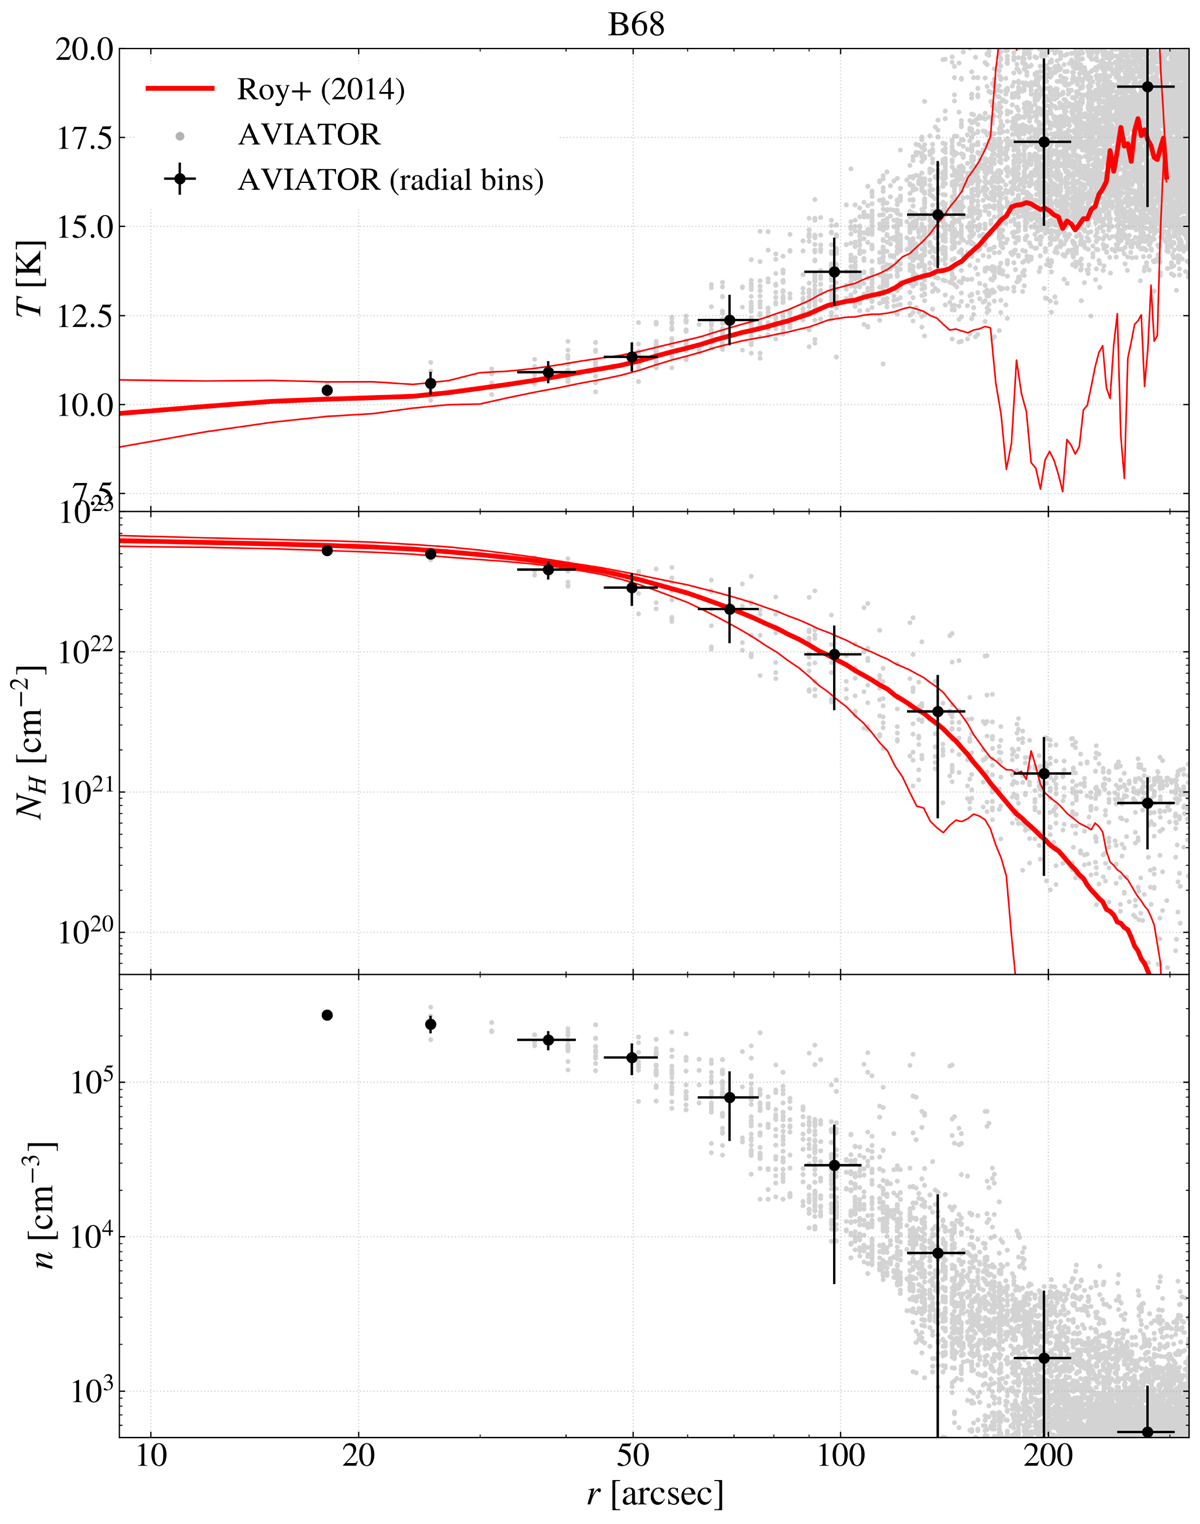
Radial profiles in temperature (top), column density (centre), and volume density (bottom) for the core B68. Grey circles show the results of the AVIATOR reconstruction. Black circles indicate the mean and standard deviation of the AVIATOR reconstruction per radial bin. The red lines show the mean and standard deviation of the reconstruction by R14.
Current usage metrics show cumulative count of Article Views (full-text article views including HTML views, PDF and ePub downloads, according to the available data) and Abstracts Views on Vision4Press platform.
Data correspond to usage on the plateform after 2015. The current usage metrics is available 48-96 hours after online publication and is updated daily on week days.
Initial download of the metrics may take a while.