Open Access
Fig. 8.
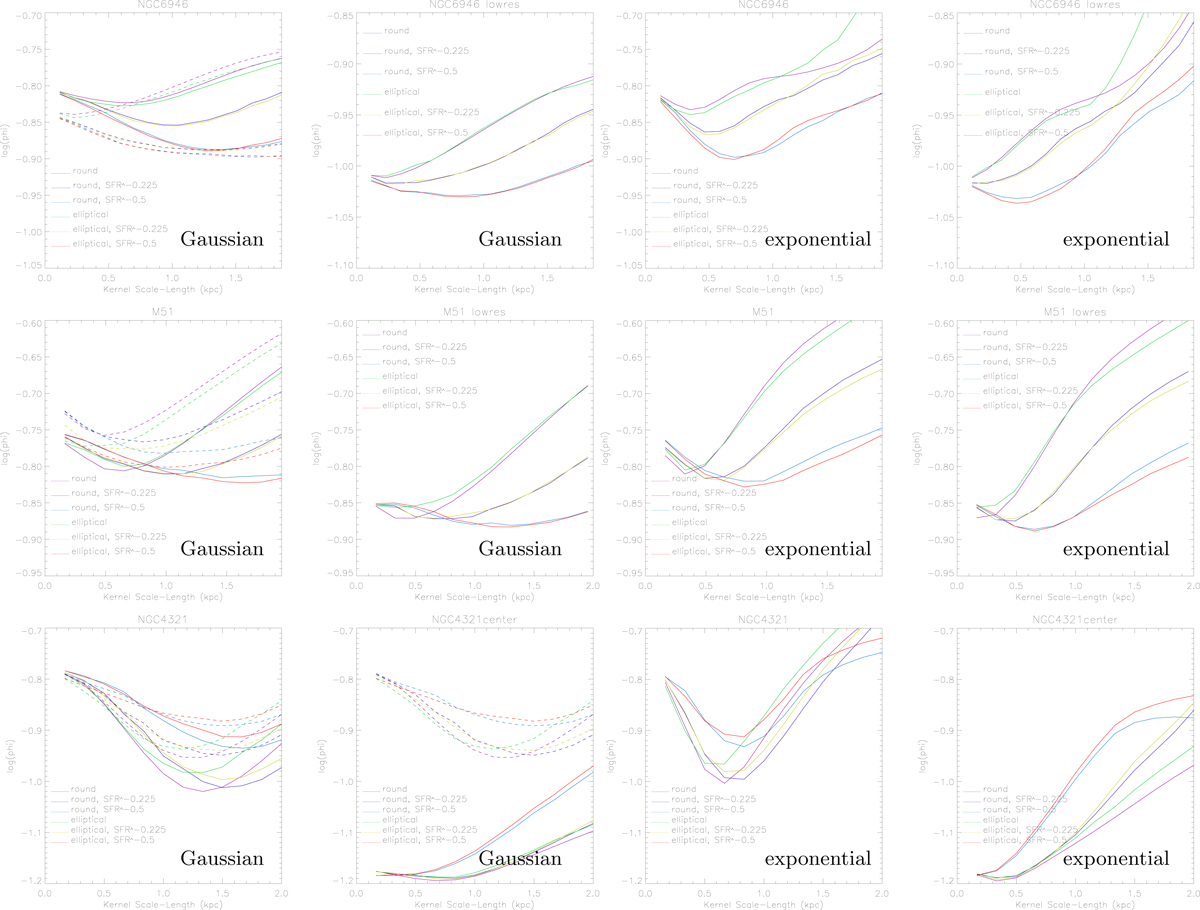
Curves of goodness ϕ associated with minimum ϕ for the 12 models. The 6 cm radio continuum observations are used. The model convolutions with different kernels are shown in different colors. The models with an enhanced source term based on the degree of polarization are shown as dashed lines.
Current usage metrics show cumulative count of Article Views (full-text article views including HTML views, PDF and ePub downloads, according to the available data) and Abstracts Views on Vision4Press platform.
Data correspond to usage on the plateform after 2015. The current usage metrics is available 48-96 hours after online publication and is updated daily on week days.
Initial download of the metrics may take a while.