Open Access
Fig. 6.
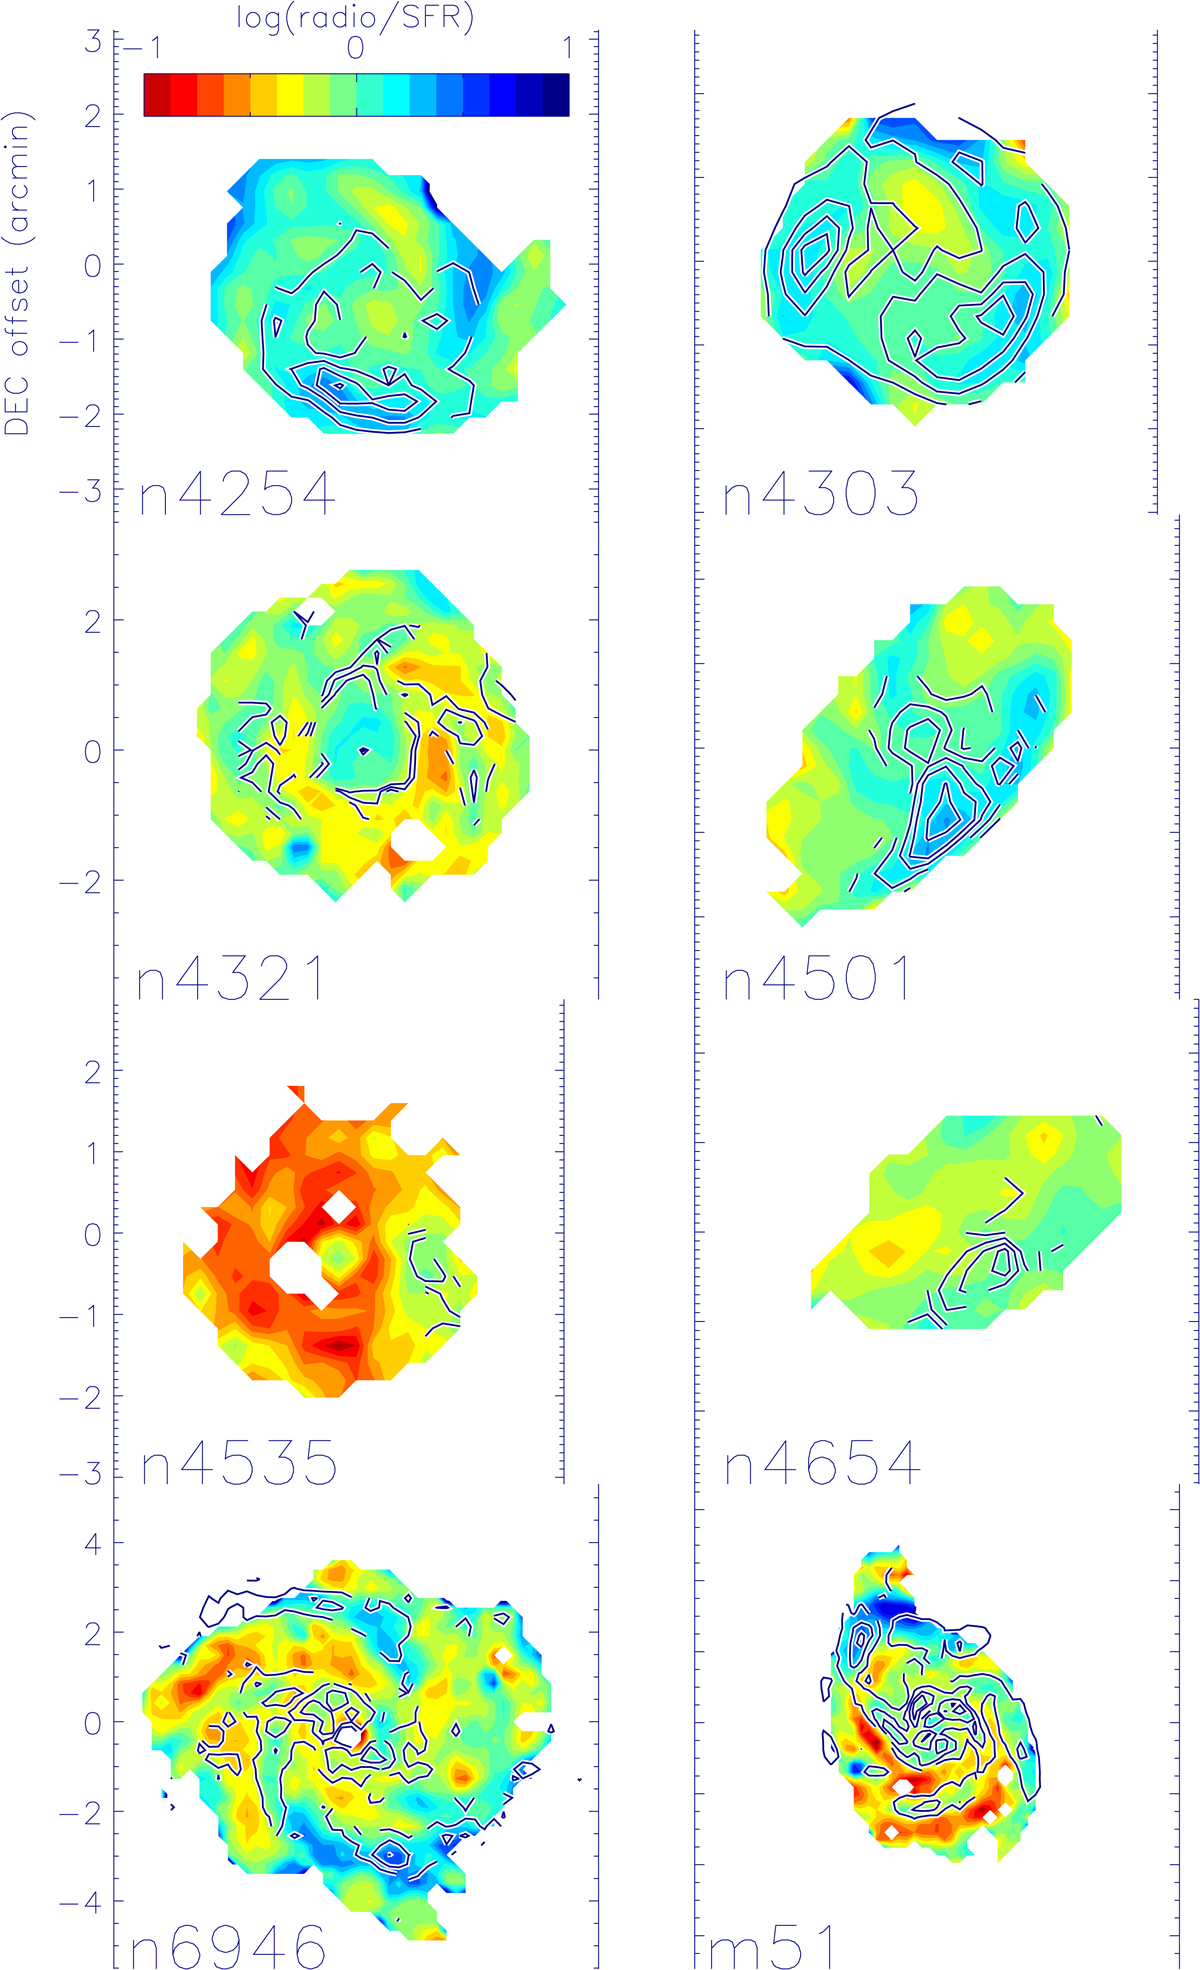
Color: radio/SFR maps (in arbitrary units). Blue is radio-bright, red is radio-dim. Blue contours: polarized radio continuum emission (Vollmer et al. 2010, 2013). The contour levels were chosen so that the asymmetric ridges of polarized emission are clearly visible.
Current usage metrics show cumulative count of Article Views (full-text article views including HTML views, PDF and ePub downloads, according to the available data) and Abstracts Views on Vision4Press platform.
Data correspond to usage on the plateform after 2015. The current usage metrics is available 48-96 hours after online publication and is updated daily on week days.
Initial download of the metrics may take a while.