Open Access
Fig. B.1.
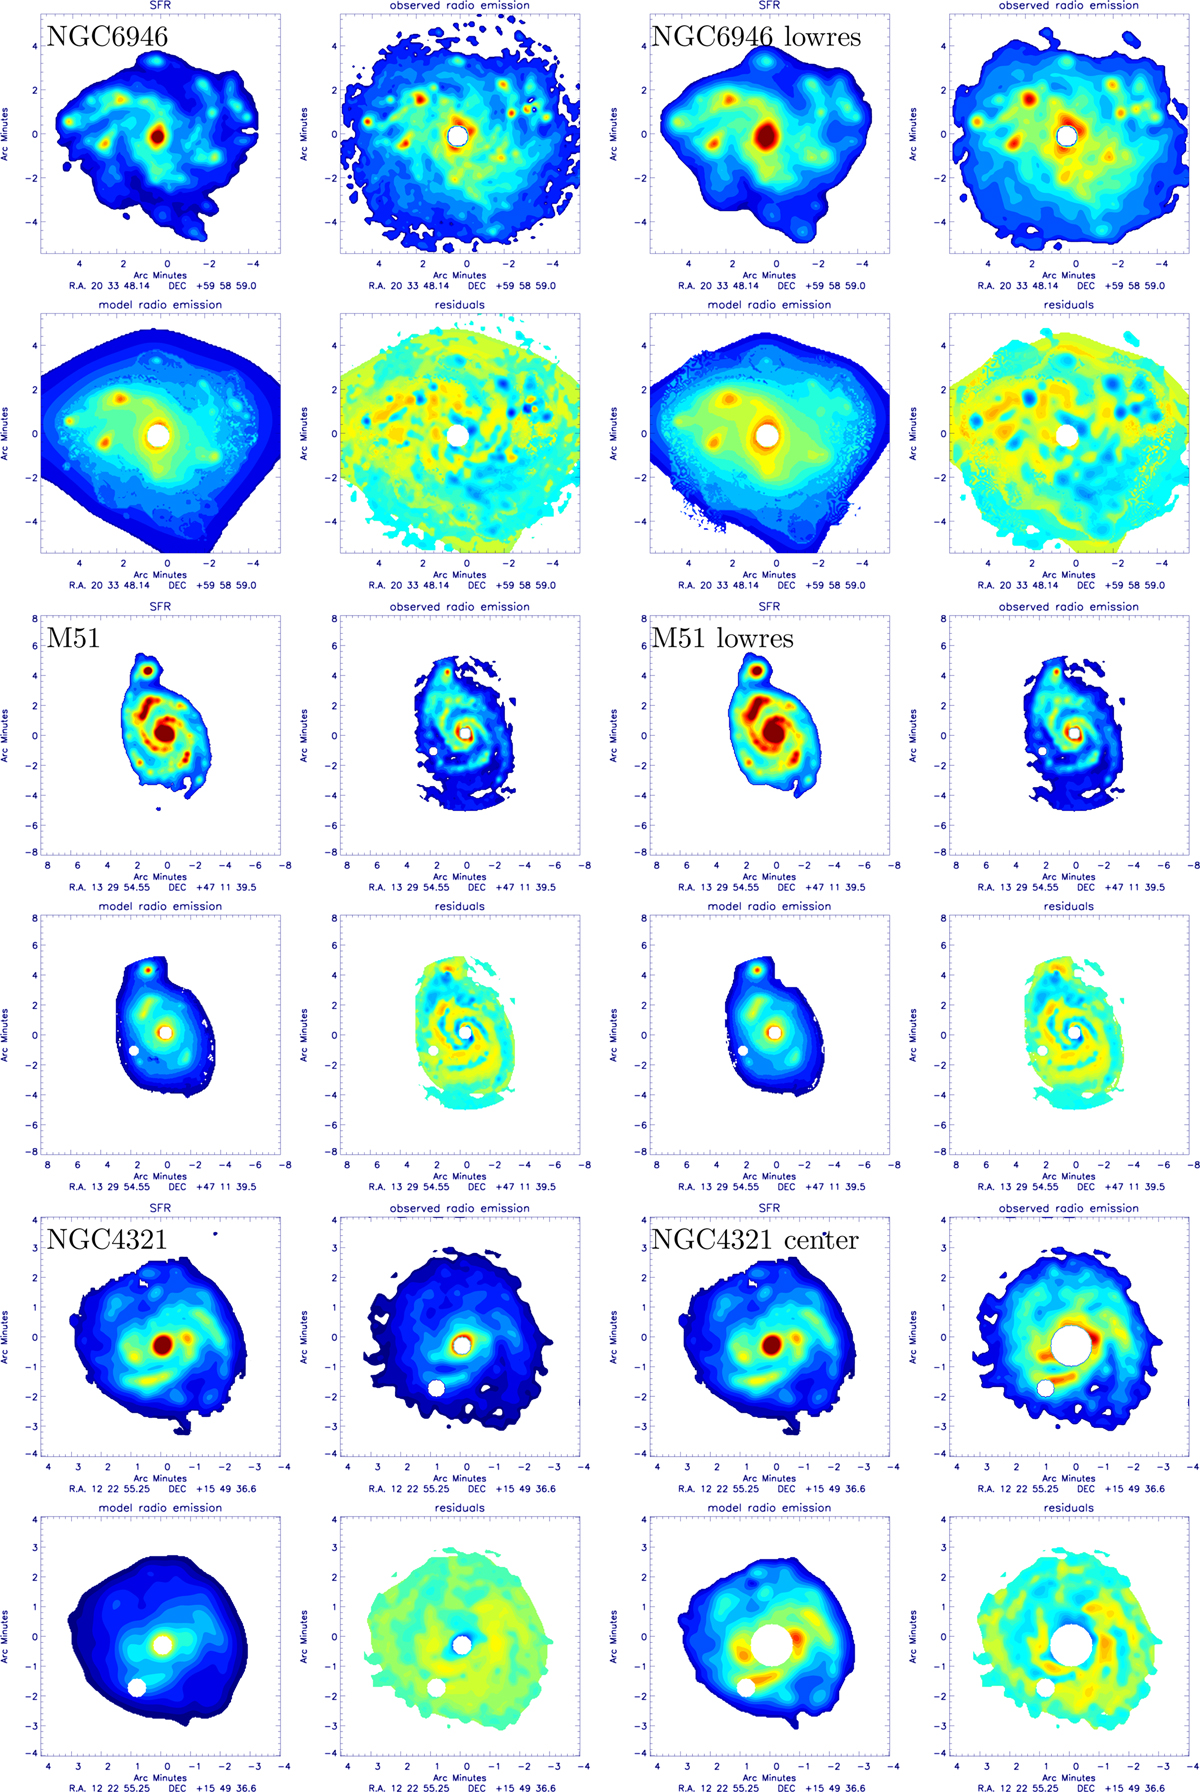
Exponential convolution: “best-fit” model radio continuum maps at 6 cm. Four maps are shown for each galaxy. Upper left: observed star formation; upper right: observed radio continuum emission; lower left: model radio continuum; lower right: residuals; blue is radio-bright, red radio-dim.
Current usage metrics show cumulative count of Article Views (full-text article views including HTML views, PDF and ePub downloads, according to the available data) and Abstracts Views on Vision4Press platform.
Data correspond to usage on the plateform after 2015. The current usage metrics is available 48-96 hours after online publication and is updated daily on week days.
Initial download of the metrics may take a while.