Free Access
Fig. 15.
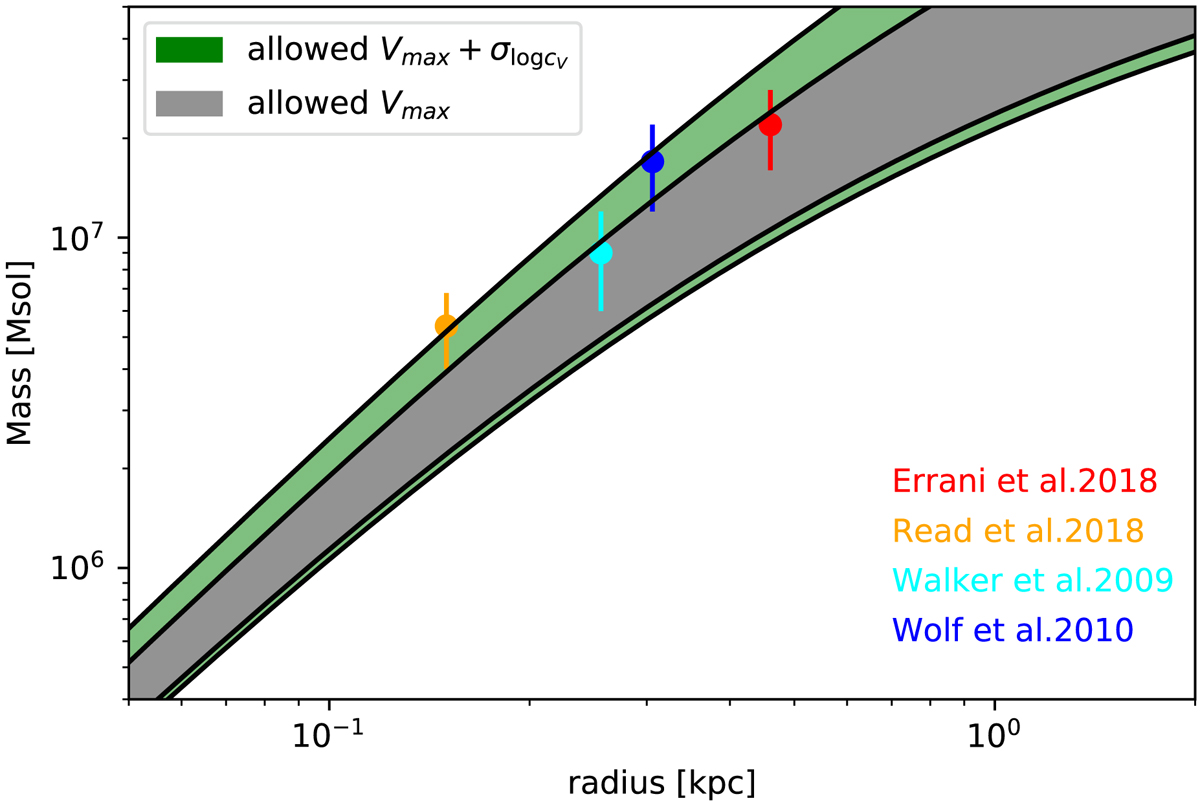
Comparison between our derived mass profile (grey shaded area) and previous mass estimates, colour-coded as indicated by the labels. Green-shaded area marks the range of mass allowed by our solution when also considering the scatter on the concentration relation.
Current usage metrics show cumulative count of Article Views (full-text article views including HTML views, PDF and ePub downloads, according to the available data) and Abstracts Views on Vision4Press platform.
Data correspond to usage on the plateform after 2015. The current usage metrics is available 48-96 hours after online publication and is updated daily on week days.
Initial download of the metrics may take a while.