Fig. C.1.
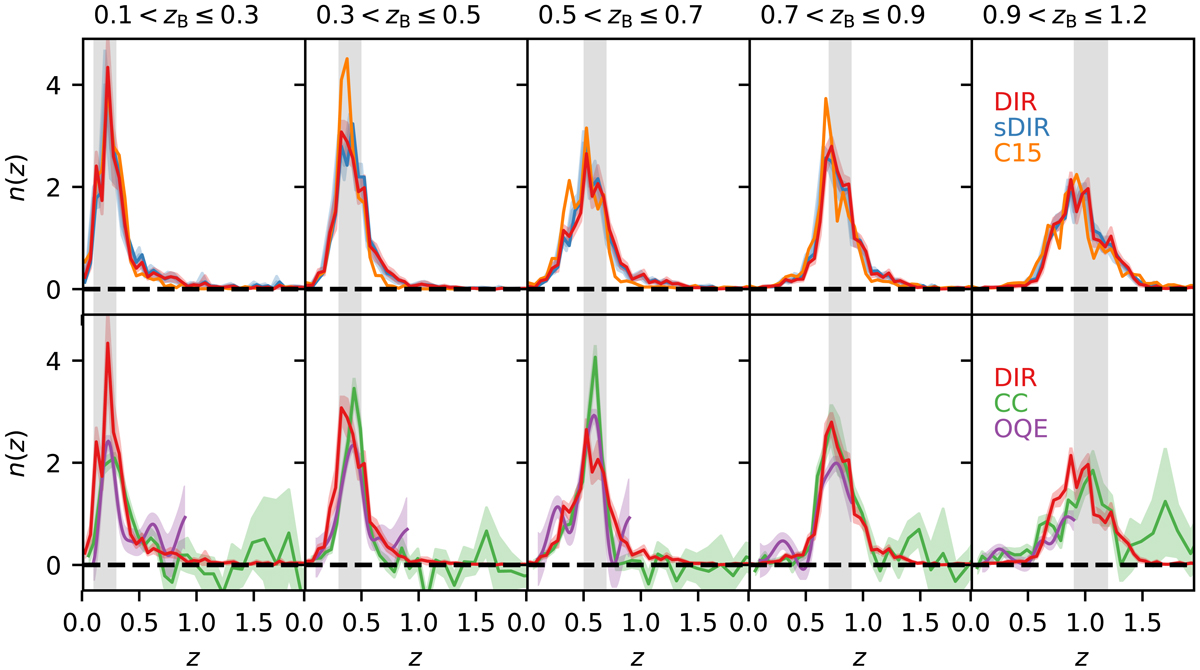
Similar to Fig. 1 showing the fiducial redshift distributions and also some alternative n(z) estimates. The red lines and their confidence regions correspond to the weighted direct calibration technique (DIR, Sect. 3.2), blue corresponds to a smoothed version of the DIR method (sDIR, Appendix C.1), and green shows the small-scale clustering-z measurements (CC, Appendix C.2) after correction for the spectroscopic bias but before fitting with a Gaussian mixture model and correction for the photometric bias (the latter being negligible). The clustering-zn(z) as estimated with the optimal-quadratic-estimator (OQE, Appendix C.3) out to z < 0.9 are shown in purple. The normalisation of the green CC estimate is somewhat ambiguous due to noise and the resulting negative amplitudes. The purple OQE estimates have been normalised to the same area as the CC estimates for the redshift range z < 0.9. We also include the DIR n(z) that result when the combined spec-z calibration sample is replaced by the COSMOS-2015 photo-z catalogue (orange; shown without uncertainties).
Current usage metrics show cumulative count of Article Views (full-text article views including HTML views, PDF and ePub downloads, according to the available data) and Abstracts Views on Vision4Press platform.
Data correspond to usage on the plateform after 2015. The current usage metrics is available 48-96 hours after online publication and is updated daily on week days.
Initial download of the metrics may take a while.