Fig. 5.
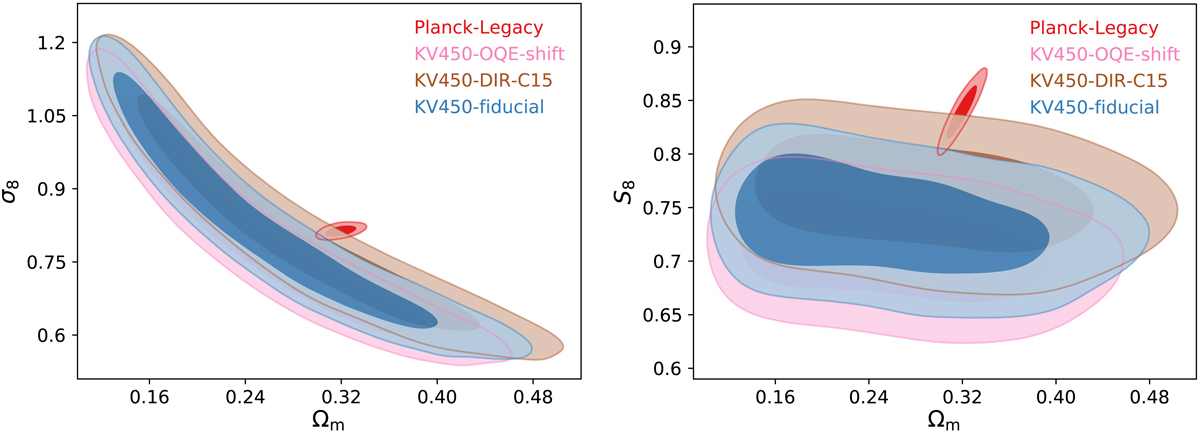
Same as Fig. 4 but for the most extreme alternative redshift distributions described in Sect. 3.2. Brown contours correspond to the redshift distributions with the highest S8 (DIR-C15) that we argue in Sect. 3.2 might produce a biased result. The pink contours correspond to the redshift distributions with the lowest S8 (OQE-shift).
Current usage metrics show cumulative count of Article Views (full-text article views including HTML views, PDF and ePub downloads, according to the available data) and Abstracts Views on Vision4Press platform.
Data correspond to usage on the plateform after 2015. The current usage metrics is available 48-96 hours after online publication and is updated daily on week days.
Initial download of the metrics may take a while.