Fig. 3.
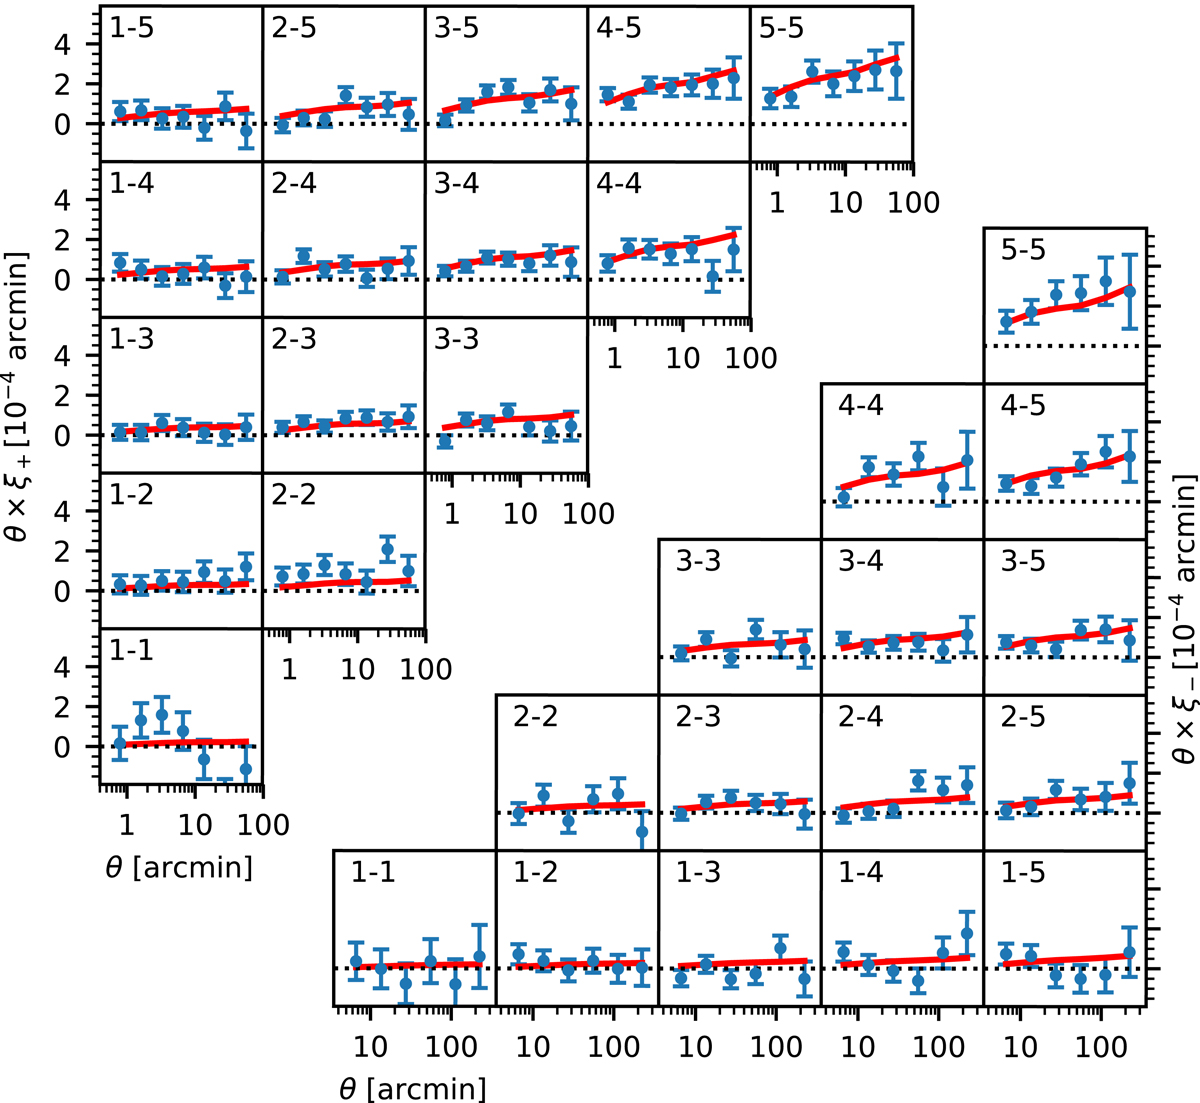
KV450 2-point shear correlation functions ξ+ (upper-left) and ξ− (lower-right) plotted as θ × ξ±. The errors shown represent the square root of the diagonal of the analytical covariance matrix. These errors are significantly correlated between scales and redshift bins. The solid red line corresponds to the best-fit (maximum likelihood) fiducial model from Sect. 7 including baryon feedback, intrinsic alignments, and all corrections for observational biases.
Current usage metrics show cumulative count of Article Views (full-text article views including HTML views, PDF and ePub downloads, according to the available data) and Abstracts Views on Vision4Press platform.
Data correspond to usage on the plateform after 2015. The current usage metrics is available 48-96 hours after online publication and is updated daily on week days.
Initial download of the metrics may take a while.