Fig. C.4.
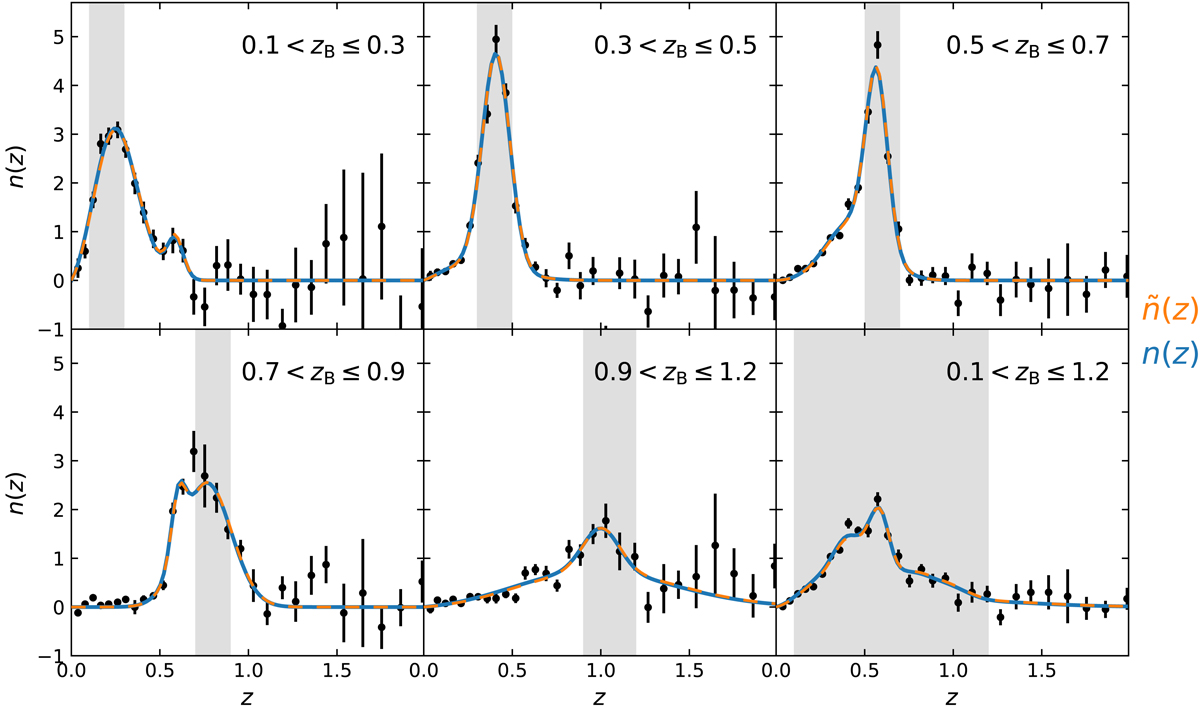
Clustering-redshift (CC) measurements for the five tomographic bins and a broad bin with 0.1 < zB ≤ 1.2. The data points represent ![]() , that is, the redshift distribution after correction for the spectroscopic bias bs(z), and the orange lines show the best-fit Gaussian-mixture-model (GMM) to these data. The blue lines show the same GMM but after correcting for the bias function ℬ(z) = (1 + z)α with the best-fit α = 0.232 ± 0.441, showing a gentle skewing to lower redshift.
, that is, the redshift distribution after correction for the spectroscopic bias bs(z), and the orange lines show the best-fit Gaussian-mixture-model (GMM) to these data. The blue lines show the same GMM but after correcting for the bias function ℬ(z) = (1 + z)α with the best-fit α = 0.232 ± 0.441, showing a gentle skewing to lower redshift.
Current usage metrics show cumulative count of Article Views (full-text article views including HTML views, PDF and ePub downloads, according to the available data) and Abstracts Views on Vision4Press platform.
Data correspond to usage on the plateform after 2015. The current usage metrics is available 48-96 hours after online publication and is updated daily on week days.
Initial download of the metrics may take a while.