Fig. C.3.
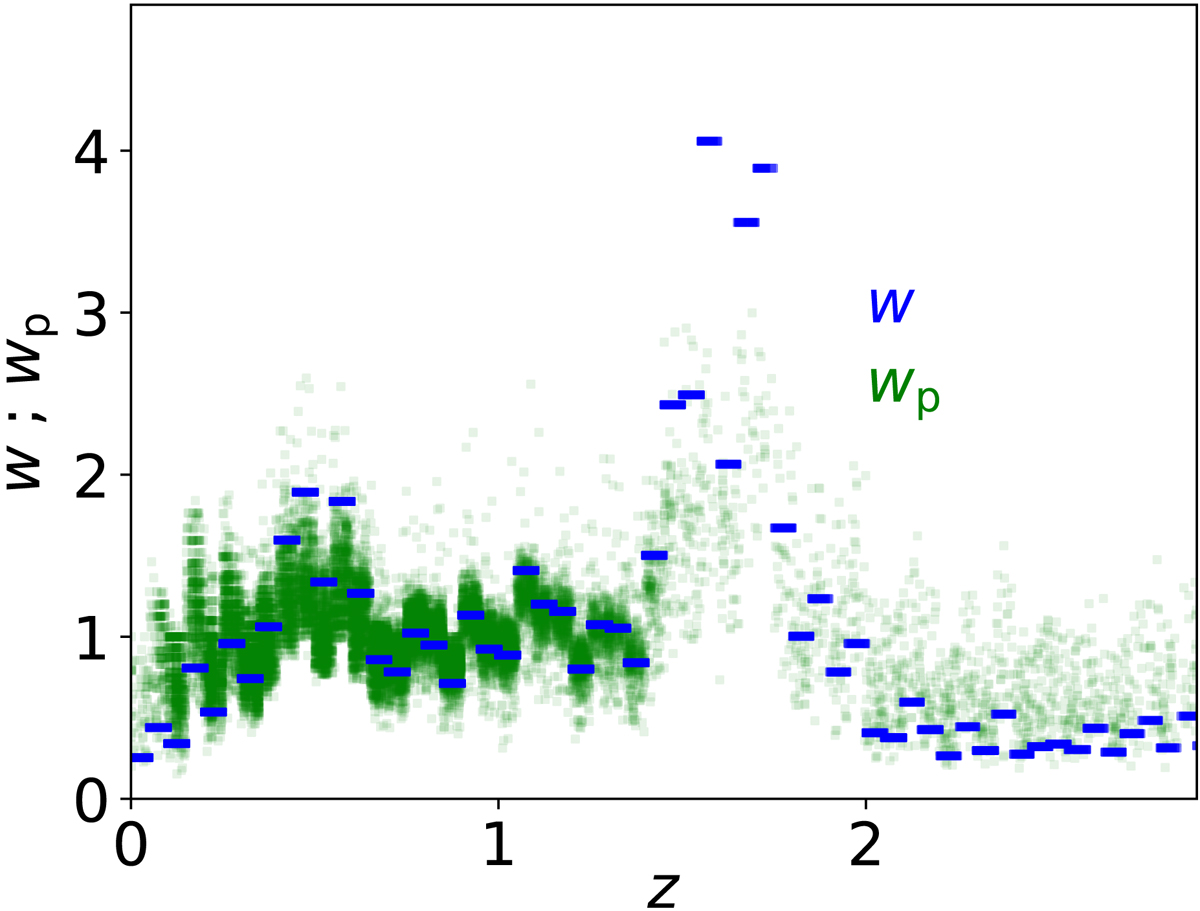
Refinement of the smoothing weight for each calibration object. The blue data points represent the initial guess of the smoothing weights, wi(z), that just depend on redshift (equivalent to the lower panel of Fig. C.2) while the green data points represent wp, i, which is the ratio of wi and the average ⟨w⟩i of the wj of the k nearest neighbours around an object i.
Current usage metrics show cumulative count of Article Views (full-text article views including HTML views, PDF and ePub downloads, according to the available data) and Abstracts Views on Vision4Press platform.
Data correspond to usage on the plateform after 2015. The current usage metrics is available 48-96 hours after online publication and is updated daily on week days.
Initial download of the metrics may take a while.