Fig. C.2.
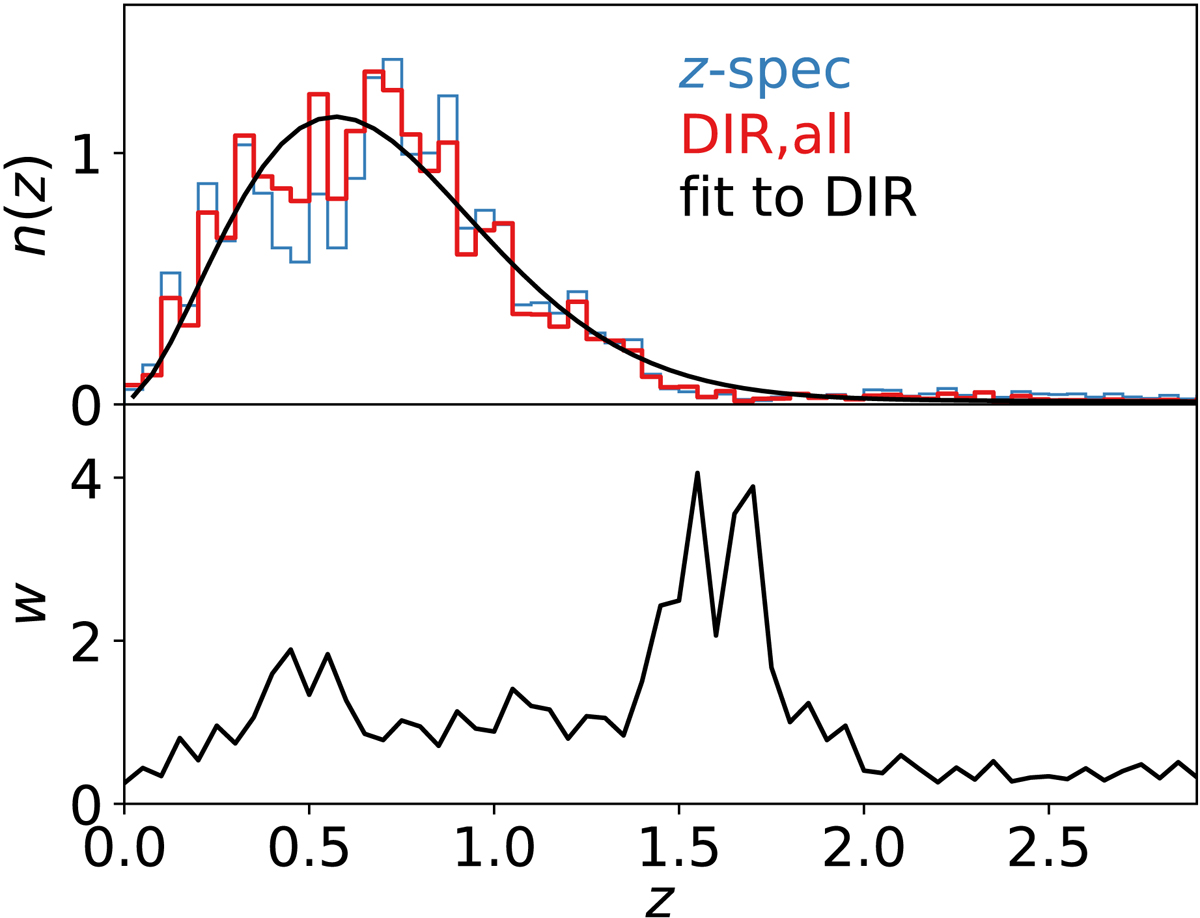
Illustration of the sDIR method. The blue line represents the unweighted spectroscopic redshift distribution of the calibration sample. The red line is the DIR estimate of the redshift distribution of the full lensing catalogue, nDIR, all(z). The black line in the upper panel shows a parametric fit to the red line and the lower panel shows the ratio of this fitted function to the blue line, which is a first guess of the smoothing weight.
Current usage metrics show cumulative count of Article Views (full-text article views including HTML views, PDF and ePub downloads, according to the available data) and Abstracts Views on Vision4Press platform.
Data correspond to usage on the plateform after 2015. The current usage metrics is available 48-96 hours after online publication and is updated daily on week days.
Initial download of the metrics may take a while.