Fig. 9.
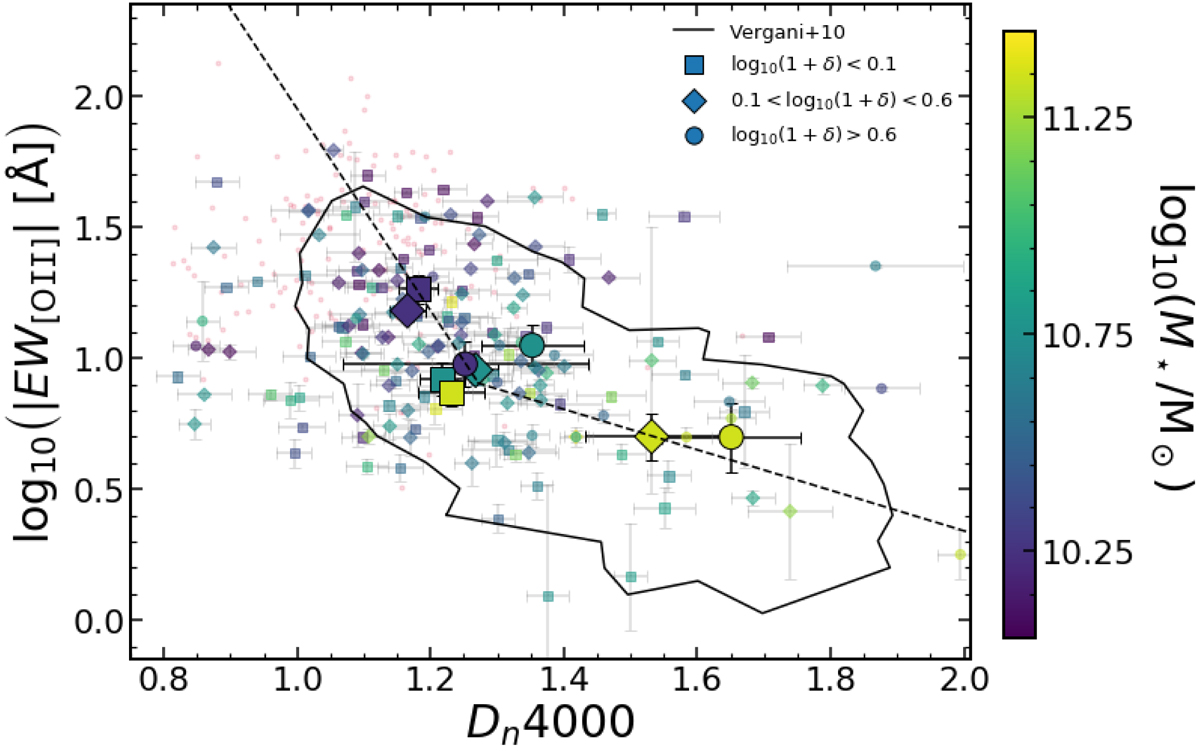
Observed relation between Dn4000 and log10(−EW[OII]) for individual galaxies (small symbols) and median per stellar mass bin (large symbols), colour-coded by their stellar mass. The small purple dots show the values for galaxies with log10(M⋆/M⊙) < 10. Different symbols correspond to different over-densities. The dashed lines are linear fits to the data of individual galaxies in two stellar mass sub-samples (see text for details): the steeper slope is the fit for galaxies with 10 < log10(M⋆/M⊙) < 11, and the shallower slope is the fit for galaxies with log10(M⋆/M⊙) > 11. This highlights the underlying anti-correlation between the observed strength of the [OII] emission and the strength of the 4000 Å break. We show as a black contour the location of 85% of the zCOSMOS sample at 0.48 < z < 1.2 with stellar masses greater than 1010 M⊙ (Vergani et al. 2010).
Current usage metrics show cumulative count of Article Views (full-text article views including HTML views, PDF and ePub downloads, according to the available data) and Abstracts Views on Vision4Press platform.
Data correspond to usage on the plateform after 2015. The current usage metrics is available 48-96 hours after online publication and is updated daily on week days.
Initial download of the metrics may take a while.