Fig. 7.
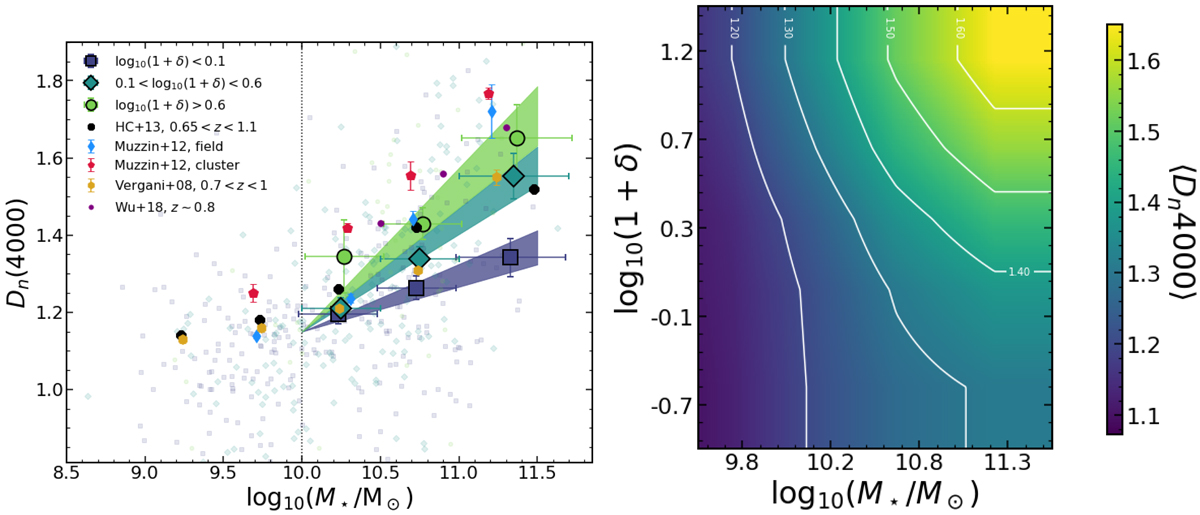
Dn4000 as a function of stellar mass for three different over-density bins. The vertical dotted line shows the representativeness limit of our survey. We show the best fit (with errors) from Eq. (6) for each density bin as shaded regions. We find an underlying correlation between stellar masses and Dn4000: the median Dn4000 of galaxies in high-density regions is higher than in low-density regions. The difference between low- and high-density environments is larger at higher stellar masses. We compare with the results from GCLASS (Muzzin et al. 2012), from VVDS (Vergani et al. 2008), from SHARDS (Hernán-Caballero et al. 2013), and from LEGA-C (Wu et al. 2018), which also show the same trends. We also show here the median value of Dn4000 as a function of both stellar mass and local density in in the right panel. This map is a smooth interpolation of the trends found in our sample and highlights the increase of the median Dn4000 with increasing stellar mass and local density.
Current usage metrics show cumulative count of Article Views (full-text article views including HTML views, PDF and ePub downloads, according to the available data) and Abstracts Views on Vision4Press platform.
Data correspond to usage on the plateform after 2015. The current usage metrics is available 48-96 hours after online publication and is updated daily on week days.
Initial download of the metrics may take a while.