Fig. 6.
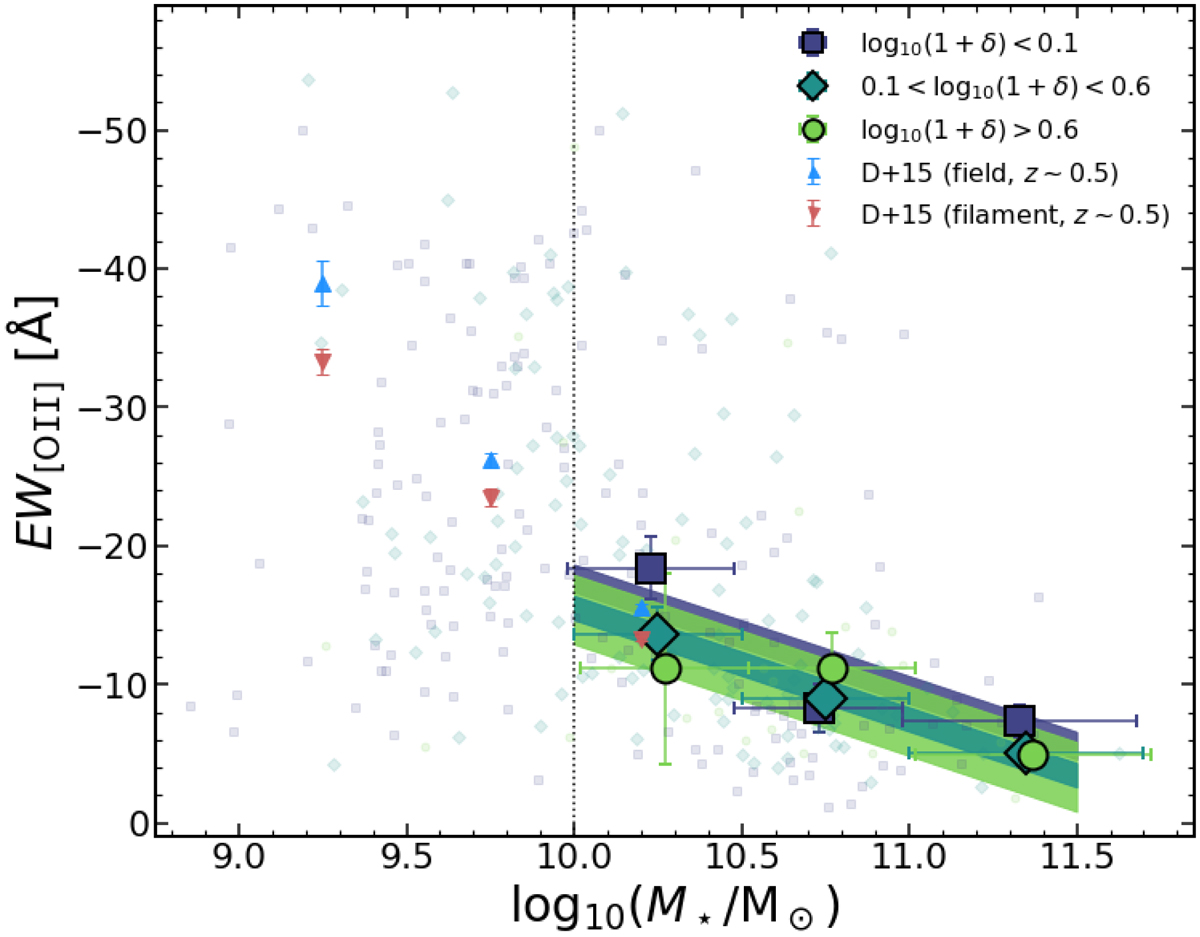
Relation between [OII] EW and stellar mass for the [OII]-emitters in our sample in three different over-density bins. We compare our results (large green and dark blue symbols are the median of the population, and the same smaller symbols represent individual measurements) with results from Darvish et al. (2015a) of filament and field galaxies, as small red and blue triangles, respectively. We show the best fit (with error estimate) from Eq. (5) for each density bin as shaded regions. We show that higher stellar mass galaxies have weaker [OII] emission, and this relation is seen in all over-density subsets.
Current usage metrics show cumulative count of Article Views (full-text article views including HTML views, PDF and ePub downloads, according to the available data) and Abstracts Views on Vision4Press platform.
Data correspond to usage on the plateform after 2015. The current usage metrics is available 48-96 hours after online publication and is updated daily on week days.
Initial download of the metrics may take a while.