Fig. 3.
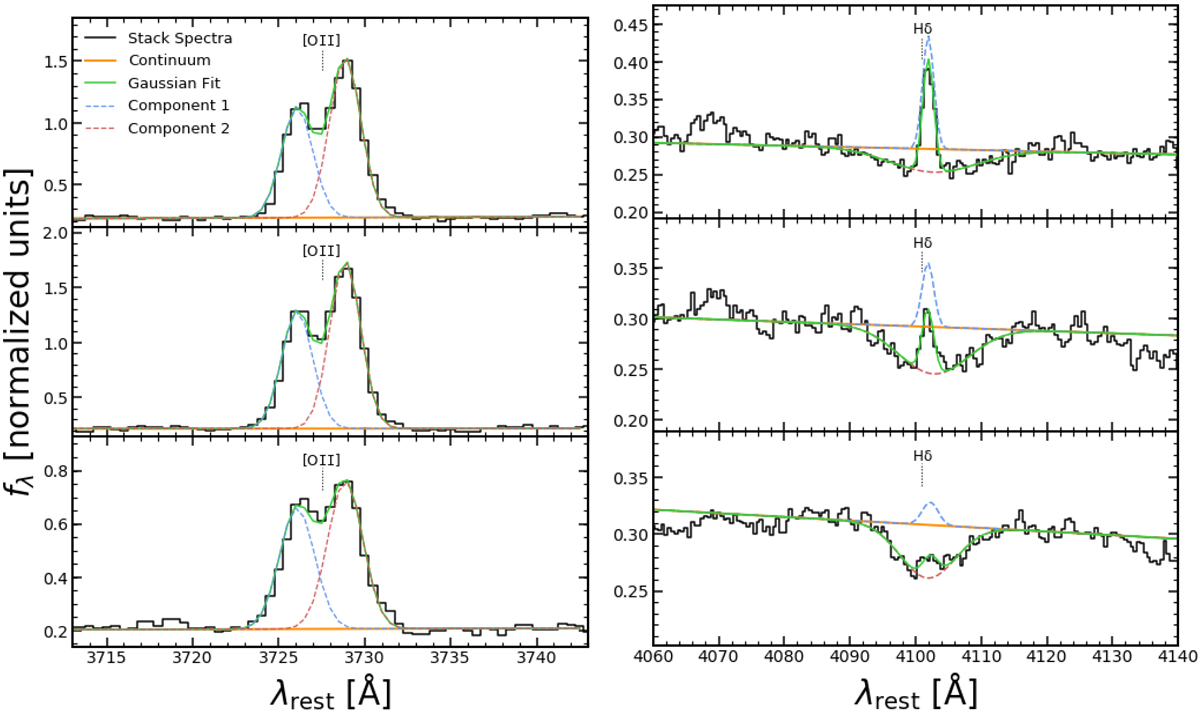
Three examples of the fit to the stacked [O II] emission (left) and the stacked Hδ absorption + emission (right) spectral lines. The solid black line shows the observed spectrum. The green line shows the median fit (after 10 000 realizations), and the orange line is the estimated continuum around the line. We also show in red and blue dashed lines the fit of each Gaussian component.
Current usage metrics show cumulative count of Article Views (full-text article views including HTML views, PDF and ePub downloads, according to the available data) and Abstracts Views on Vision4Press platform.
Data correspond to usage on the plateform after 2015. The current usage metrics is available 48-96 hours after online publication and is updated daily on week days.
Initial download of the metrics may take a while.