Fig. A.1.
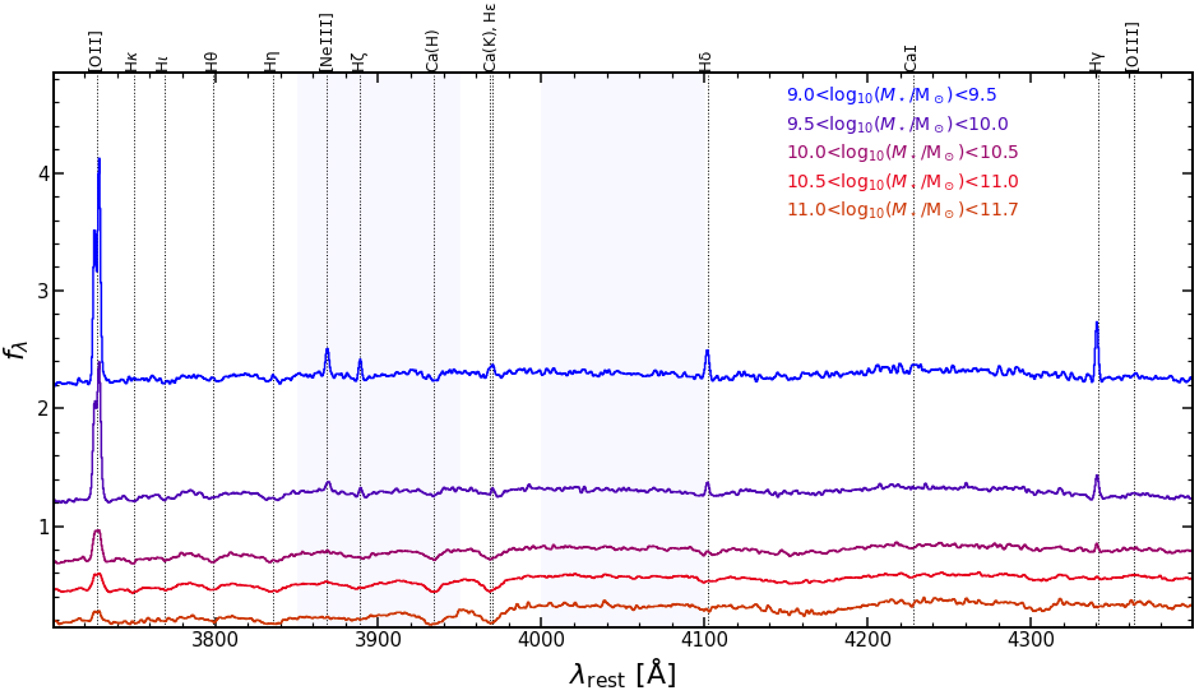
Resulting median composite spectra normalized at 4150−4300 Å and associated error (solid line + shaded region) in stellar mass bins (low to high stellar mass from top to bottom). We apply a vertical offset for visualization purposes. We highlight the strongest features that we see in our spectra with vertical lines. The light grey vertical stripes show the spectral ranges that we used to compute Dn4000.
Current usage metrics show cumulative count of Article Views (full-text article views including HTML views, PDF and ePub downloads, according to the available data) and Abstracts Views on Vision4Press platform.
Data correspond to usage on the plateform after 2015. The current usage metrics is available 48-96 hours after online publication and is updated daily on week days.
Initial download of the metrics may take a while.