Fig. 1.
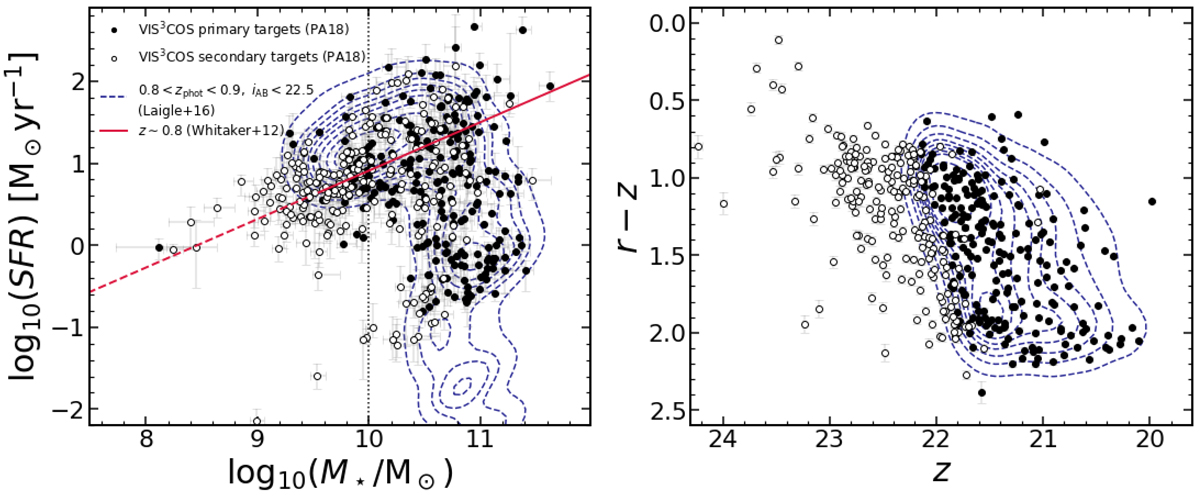
Stellar masses and SFRs derived from SED fitting in our spectroscopic sample at 0.8 < z < 0.9, showing the primary (filled circles) and secondary (open circles) targets separately (left). Colour-magnitude diagram for the same sample (right). For comparison, we show the derived best-fit relation for star-forming galaxies computed at z = 0.84 using the equation derived by Whitaker et al. (2012) over a large average volume in the COSMOS field (the dashed line is an extrapolation below their stellar mass completeness). The vertical dotted line shows the approximate stellar-mass representativeness limit of our survey. The dotted contours show the COSMOS2015 distribution of galaxies with 0.8 < zphot < 0.9 and iAB < 22.5 from 10% to 90% of the sample in 10% steps.
Current usage metrics show cumulative count of Article Views (full-text article views including HTML views, PDF and ePub downloads, according to the available data) and Abstracts Views on Vision4Press platform.
Data correspond to usage on the plateform after 2015. The current usage metrics is available 48-96 hours after online publication and is updated daily on week days.
Initial download of the metrics may take a while.