Fig. 9.
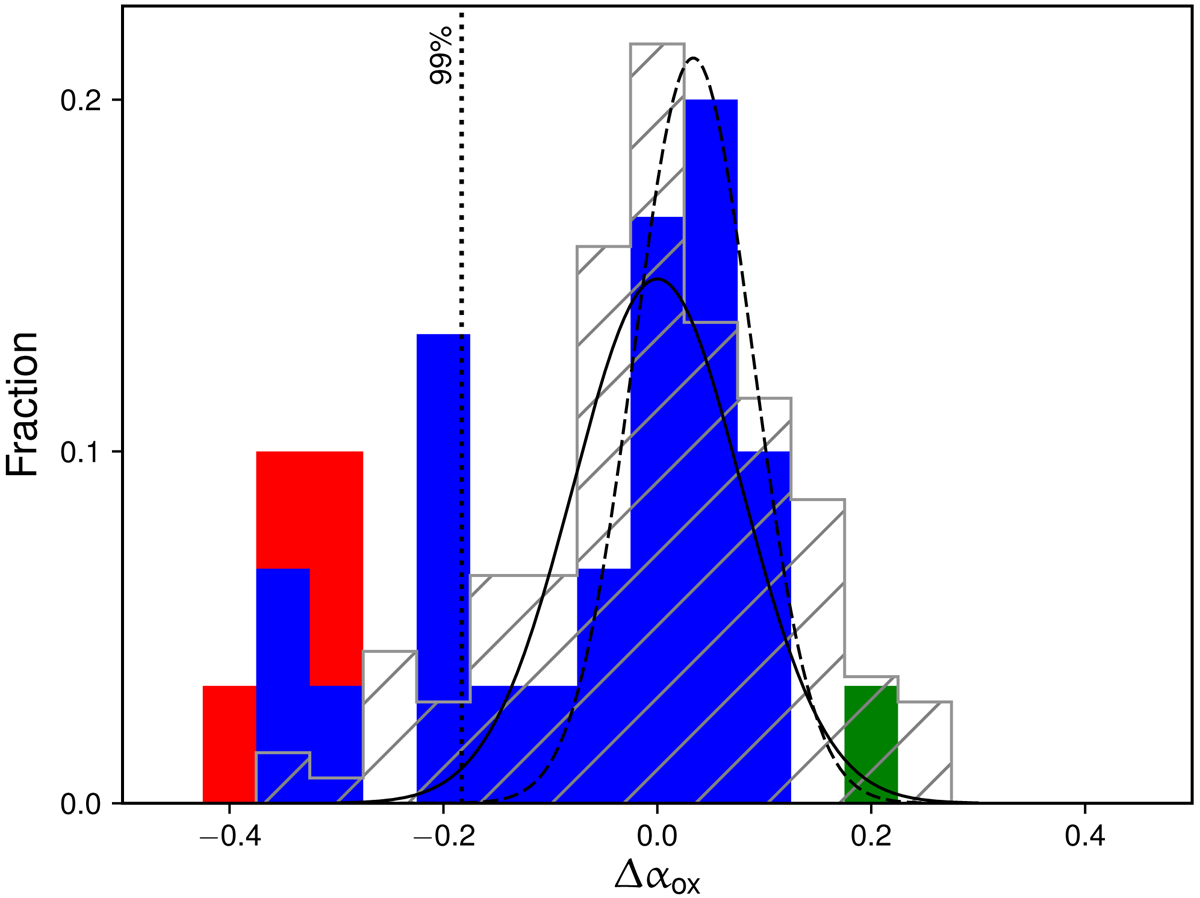
Distribution of the differences between the observed αox and the value predicted from the LX–LUV correlation for all the quasars in the z ≃ 3 sample. The dashed and solid curves are the best-fitting normal distributions for the core subset of the 25 radio-quiet sources (plotted in blue), where the peak position is left free to vary or forced to be at Δαox = 0. The dotted vertical line marks the one-sided 99% probability for the latter curve. Irrespective of the exact assumptions (see Sect. 5), a substantial fraction of objects clearly fall in the “X-ray weak” tail. The hatched grey distribution refers to “sample B” of Gibson et al. (2008).
Current usage metrics show cumulative count of Article Views (full-text article views including HTML views, PDF and ePub downloads, according to the available data) and Abstracts Views on Vision4Press platform.
Data correspond to usage on the plateform after 2015. The current usage metrics is available 48-96 hours after online publication and is updated daily on week days.
Initial download of the metrics may take a while.