Fig. 7.
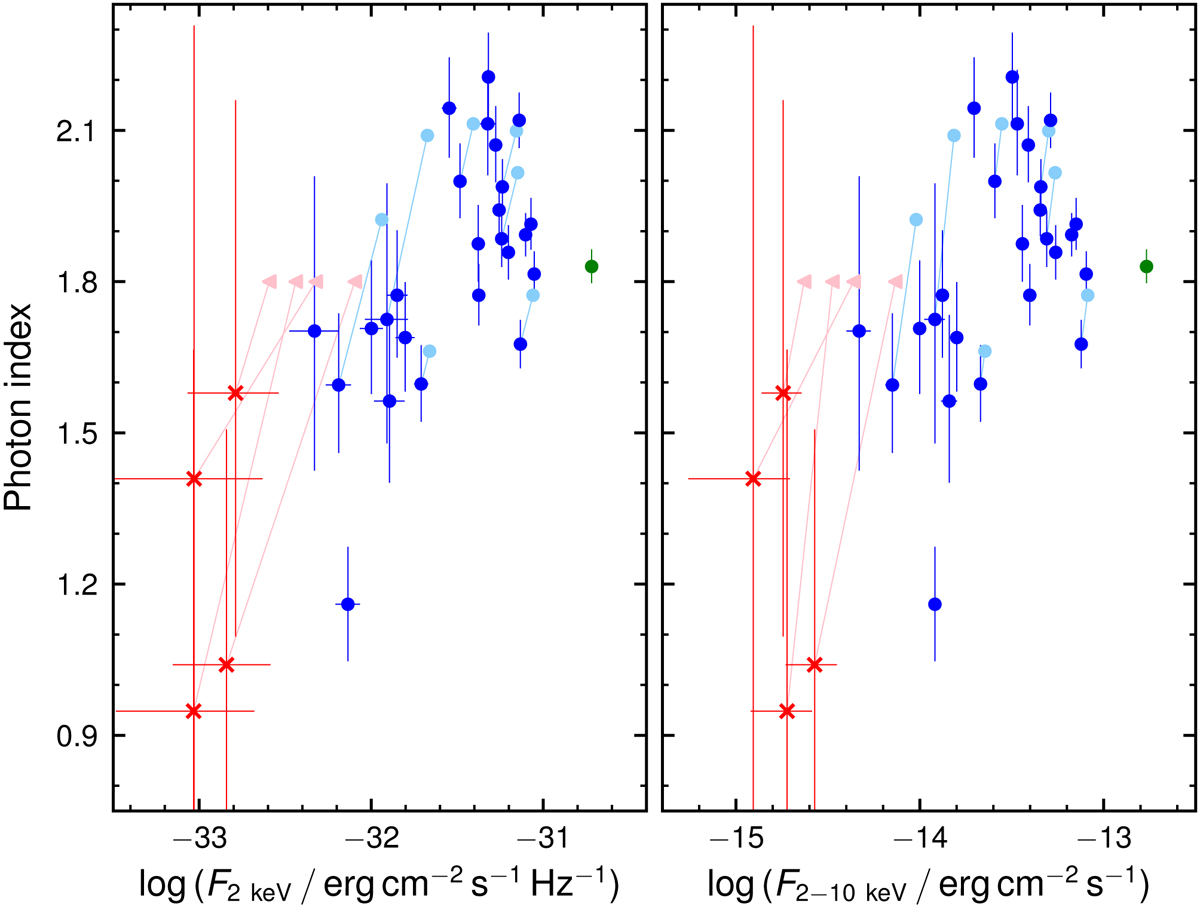
Continuum photon index against intrinsic flux density at rest-frame 2 keV (left) and 2−10 keV integrated flux (right). The colour code is the same adopted in the previous figure. The lighter symbols, when present, show the correction required if local absorption were statistically significant. Here the observed best-fit slope is also plotted for the four faintest objects (red crosses), for which an intrinsic Γ = 1.8 is then conservatively assumed for the sake of discussion (Table 2).
Current usage metrics show cumulative count of Article Views (full-text article views including HTML views, PDF and ePub downloads, according to the available data) and Abstracts Views on Vision4Press platform.
Data correspond to usage on the plateform after 2015. The current usage metrics is available 48-96 hours after online publication and is updated daily on week days.
Initial download of the metrics may take a while.