Fig. 6.
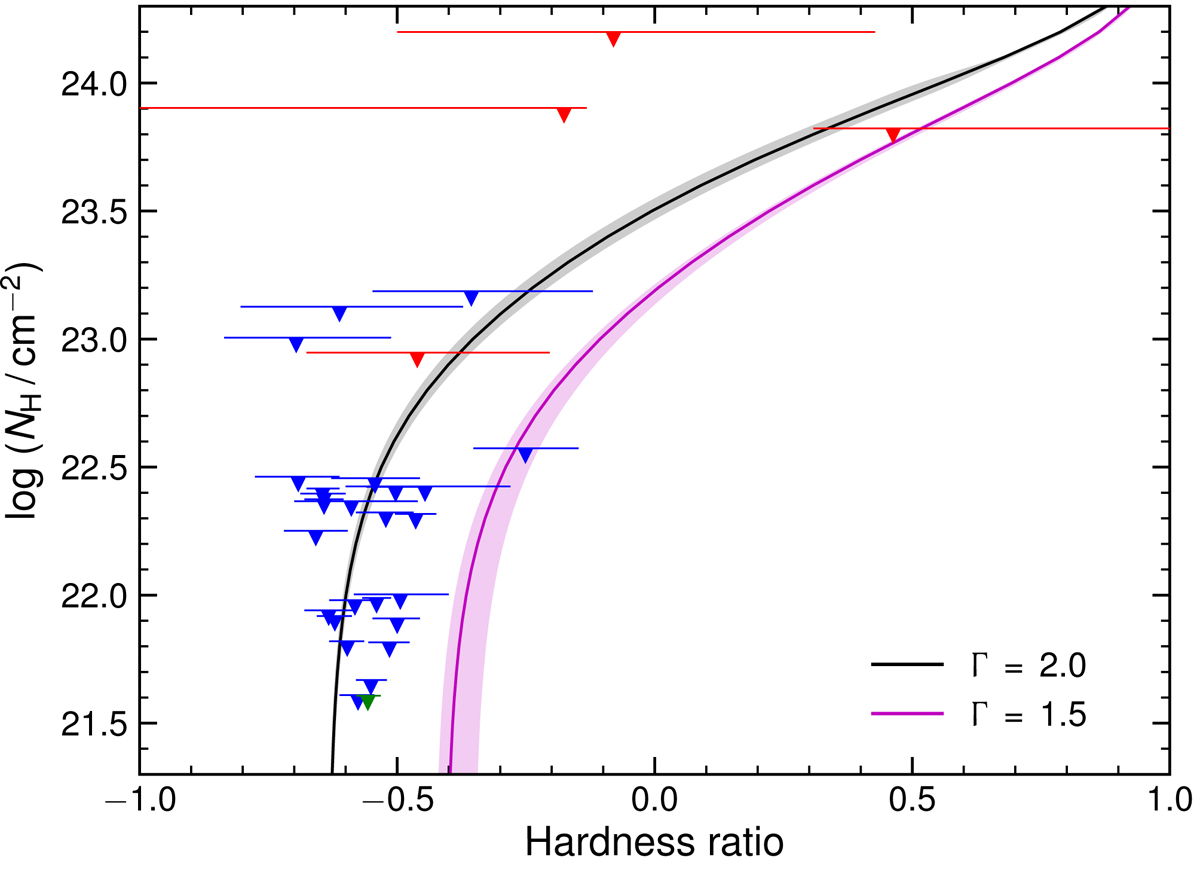
Estimated upper limits (ΔC = 3.84, equivalent to the 95% confidence level in the Gaussian approximation) on the column density NH(z) as a function of the observed hardness ratio for each source of our sample. Such constraints are obtained from the spectral fits with an absorbed power-law model, where an intrinsic continuum with Γ = 1.8 was adopted for the faintest objects (red symbols). The synthetic NH(z)–HR curves corresponding to an absorbed spectrum with Γ = 2.0 (black) and 1.5 (magenta) are also plotted for reference. These have been computed for the mean Galactic column (![]() cm−2) and quasar redshift (z = 3.14), assuming the energy-dependent response of the pn detector. The grey and lilac shaded areas respectively illustrate the uncertainties due to the full range of
cm−2) and quasar redshift (z = 3.14), assuming the energy-dependent response of the pn detector. The grey and lilac shaded areas respectively illustrate the uncertainties due to the full range of ![]() and z covered by the sample. The large majority of our objects are consistent with being, at most, mildly obscured (i.e. NH < a few ×1022 cm−2).
and z covered by the sample. The large majority of our objects are consistent with being, at most, mildly obscured (i.e. NH < a few ×1022 cm−2).
Current usage metrics show cumulative count of Article Views (full-text article views including HTML views, PDF and ePub downloads, according to the available data) and Abstracts Views on Vision4Press platform.
Data correspond to usage on the plateform after 2015. The current usage metrics is available 48-96 hours after online publication and is updated daily on week days.
Initial download of the metrics may take a while.