Fig. 5.
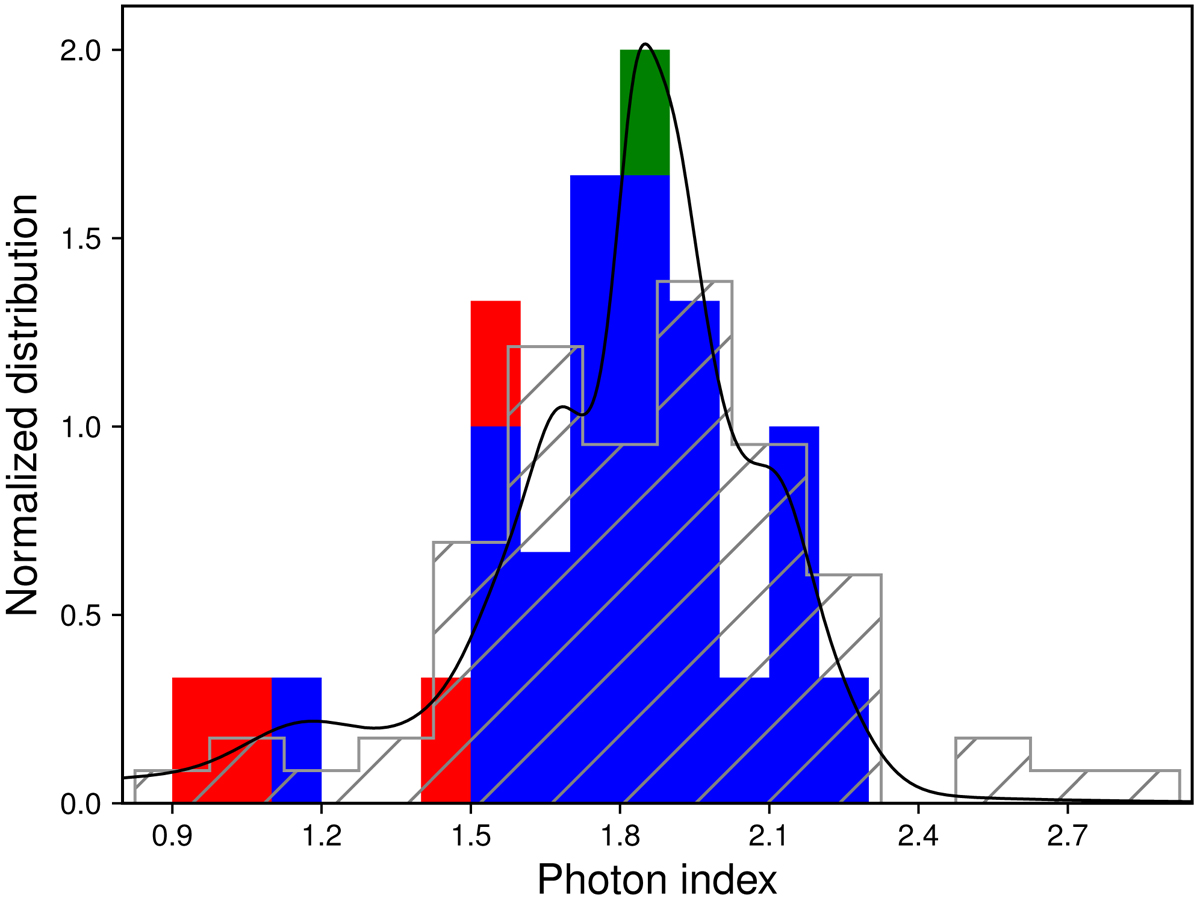
Distribution of the power-law photon index in our sample as obtained from the baseline model, phabs × zpowerlw. The colour code is as follows: green for the radio-loud object, red for the marginal detections, blue for all the other sources. The same convention will be used, when relevant, in all of the following figures. The solid line represents an approximated probability density function that also takes into account the uncertainty in each measurement of Γ (see the text for more details). The dotted histogram is the (normalized) distribution of hard X-ray continuum slopes for the quasars in the CAIXA sample, corrected for a luminosity-dependent reflection component (Bianchi et al. 2009).
Current usage metrics show cumulative count of Article Views (full-text article views including HTML views, PDF and ePub downloads, according to the available data) and Abstracts Views on Vision4Press platform.
Data correspond to usage on the plateform after 2015. The current usage metrics is available 48-96 hours after online publication and is updated daily on week days.
Initial download of the metrics may take a while.