Fig. 4.
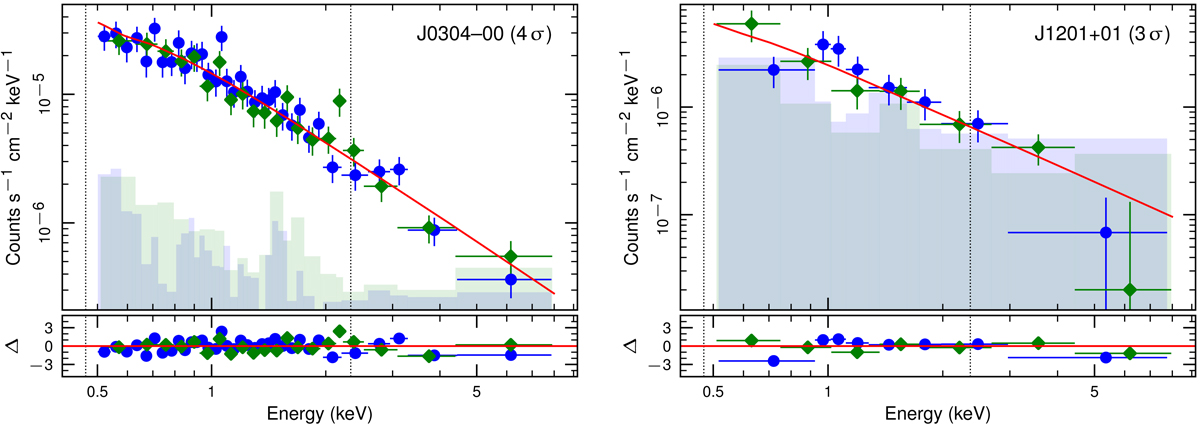
Typical XMM–Newton spectra of our z ≃ 3 quasars, as obtained in this campaign. The same sources already shown in Fig. 3, i.e. J0304−00 (left) and J1201+01 (right), have been chosen here to illustrate the full range of spectral quality. Blue dots and green diamonds are used for pn and MOS spectra, respectively, where in the latter case the data from both detectors were merged for visual clarity. The red solid line represents the best-fit power-law continuum with no intrinsic absorption. Residuals with respect to this fit were computed as Δ = (data−model)/error, and are shown in the bottom panels. A graphical rebinning is applied for plotting purposes only so that each energy channel has the significance reported within brackets in the top right-hand corner. The shaded regions indicate the background levels, while the vertical dotted lines mark the rest-frame 2 and 10 keV positions. The spectra of all the other sources, when available, can be found in Fig. A.1.
Current usage metrics show cumulative count of Article Views (full-text article views including HTML views, PDF and ePub downloads, according to the available data) and Abstracts Views on Vision4Press platform.
Data correspond to usage on the plateform after 2015. The current usage metrics is available 48-96 hours after online publication and is updated daily on week days.
Initial download of the metrics may take a while.