Fig. 3.
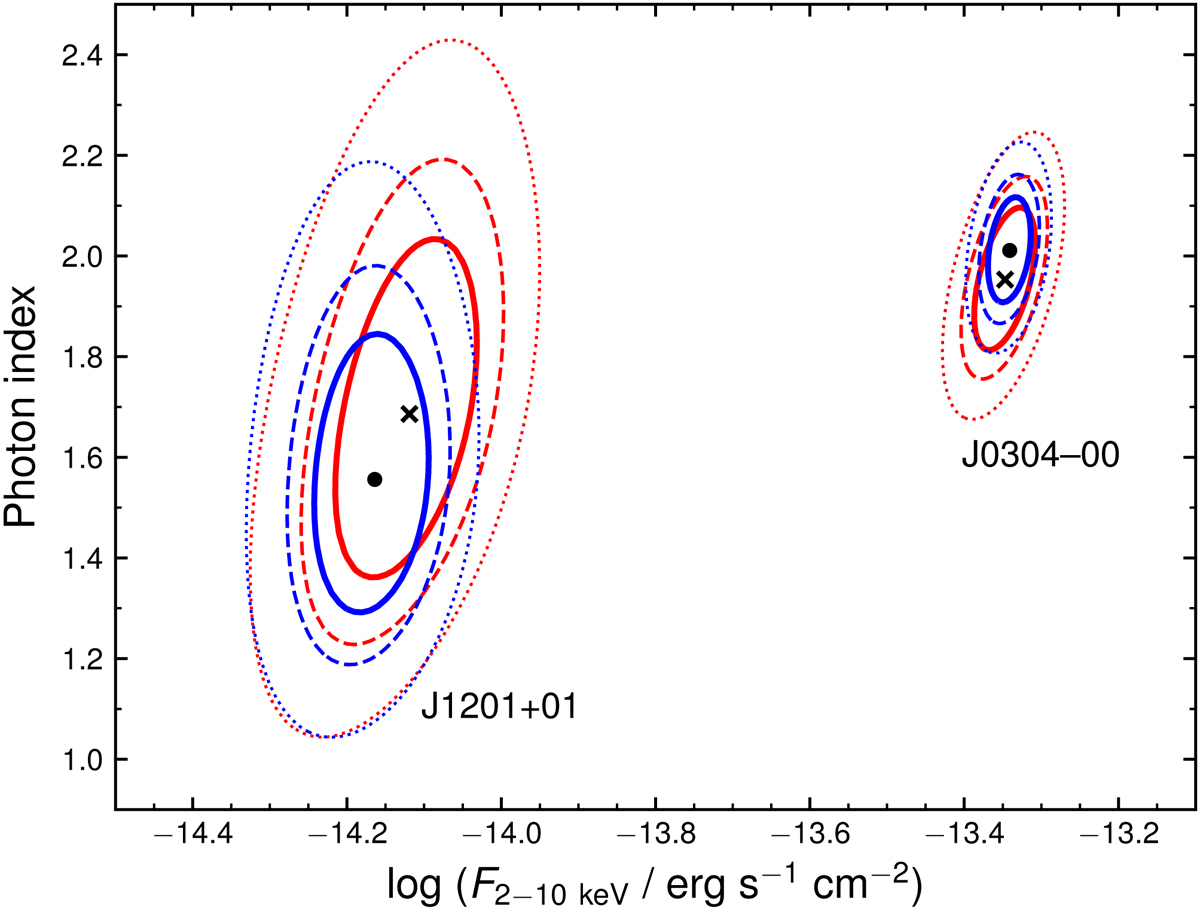
Confidence contours corresponding to ΔC = 2.30 (solid), 4.61 (dashed), 9.21 (dotted) in the Γ vs. flux plane, as obtained from a separate analysis of pn (blue curves, with best-fit value marked by a dot) and MOS (red curves, cross) spectra. Two examples are shown to be representative of the brightest (J0304−00, ∼1100 cumulative net counts) and faintest (J1201+01, ∼200 counts) sources in our sample. The agreement between pn and MOS is always remarkable, and well within the measurement uncertainties even for spectra of relatively low quality.
Current usage metrics show cumulative count of Article Views (full-text article views including HTML views, PDF and ePub downloads, according to the available data) and Abstracts Views on Vision4Press platform.
Data correspond to usage on the plateform after 2015. The current usage metrics is available 48-96 hours after online publication and is updated daily on week days.
Initial download of the metrics may take a while.