Fig. 6.
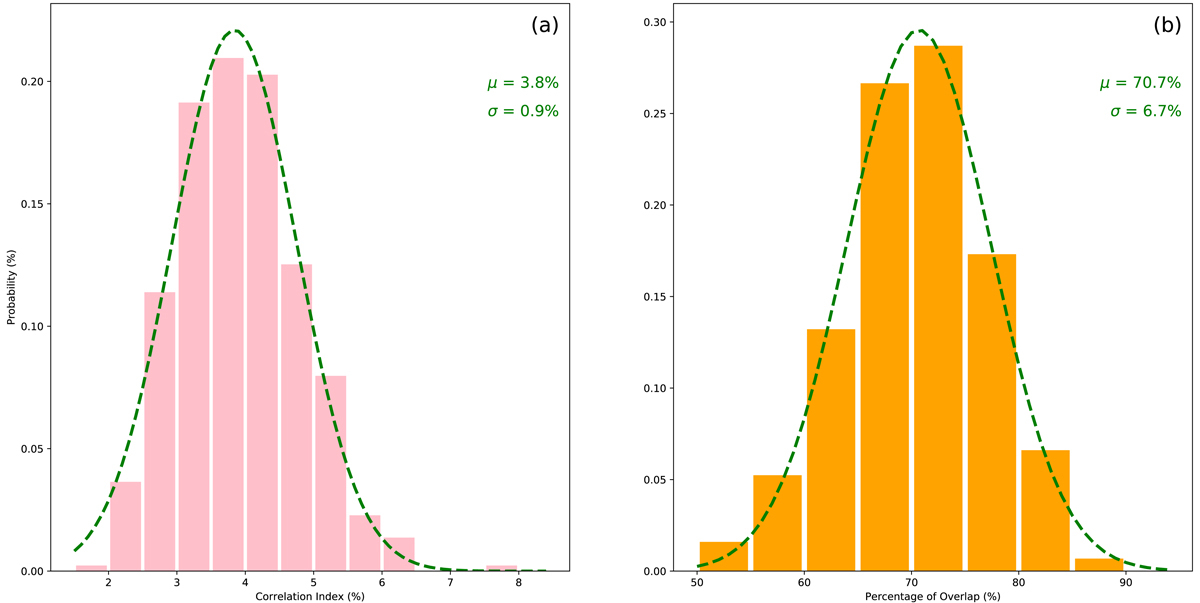
Correlation between photospheric velocity and magnetic swirls. Panel a: distribution of the correlation index (CI) between Γ2 maps from co-temporal photospheric horizontal velocity and vertical magnetic field maps. Panel b: distribution of the percentage of velocity swirls in each frame, which overlap with photospheric magnetic swirls. The green dashed lines in both panels are the corresponding Gaussian fit results, and μ and γ are the mean and standard deviation of the Gaussian fit, respectively.
Current usage metrics show cumulative count of Article Views (full-text article views including HTML views, PDF and ePub downloads, according to the available data) and Abstracts Views on Vision4Press platform.
Data correspond to usage on the plateform after 2015. The current usage metrics is available 48-96 hours after online publication and is updated daily on week days.
Initial download of the metrics may take a while.