Fig. 5.
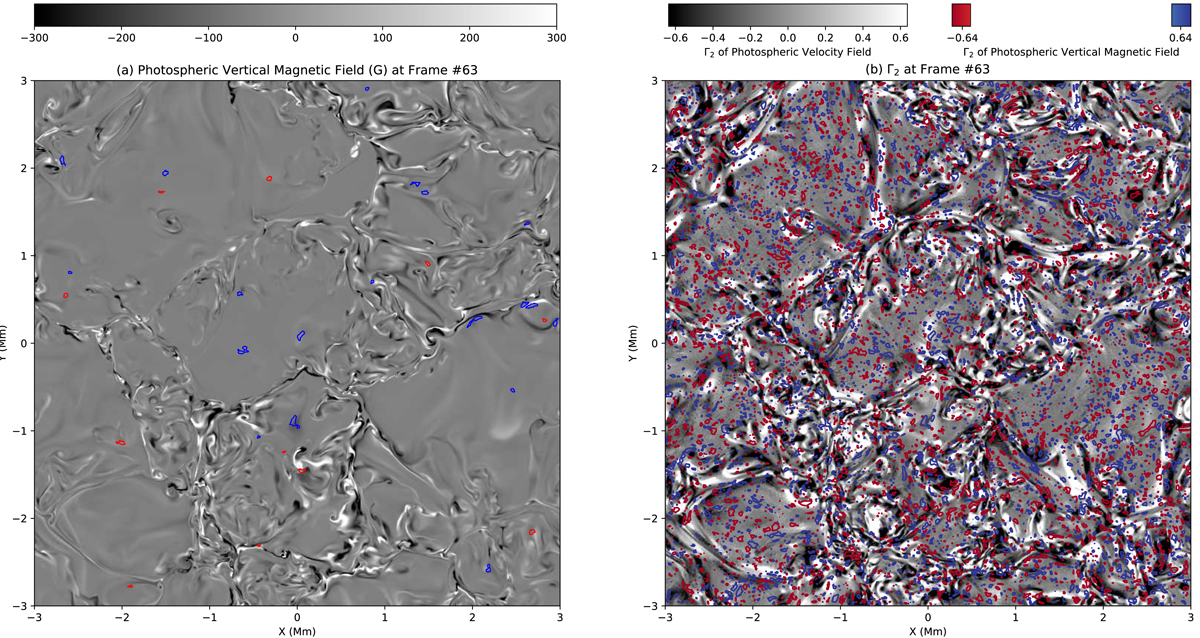
Example of the detected magnetic swirls. The black-and-white background in panel a is the photospheric vertical magnetic field at frame 63. Blue (red) dots and curves are the centres and edges of the detected magnetic swirls with a anticlockwise (clockwise) rotation. The black-and-white background in panel b denotes the Γ2 distribution obtained from the photospheric horizontal velocity field at frame 63. The red and blue contours in panel b represent the Γ2 distribution obtained from the photospheric vertical magnetic field at levels of −2/π and 2/π, respectively.
Current usage metrics show cumulative count of Article Views (full-text article views including HTML views, PDF and ePub downloads, according to the available data) and Abstracts Views on Vision4Press platform.
Data correspond to usage on the plateform after 2015. The current usage metrics is available 48-96 hours after online publication and is updated daily on week days.
Initial download of the metrics may take a while.