Fig. 2.
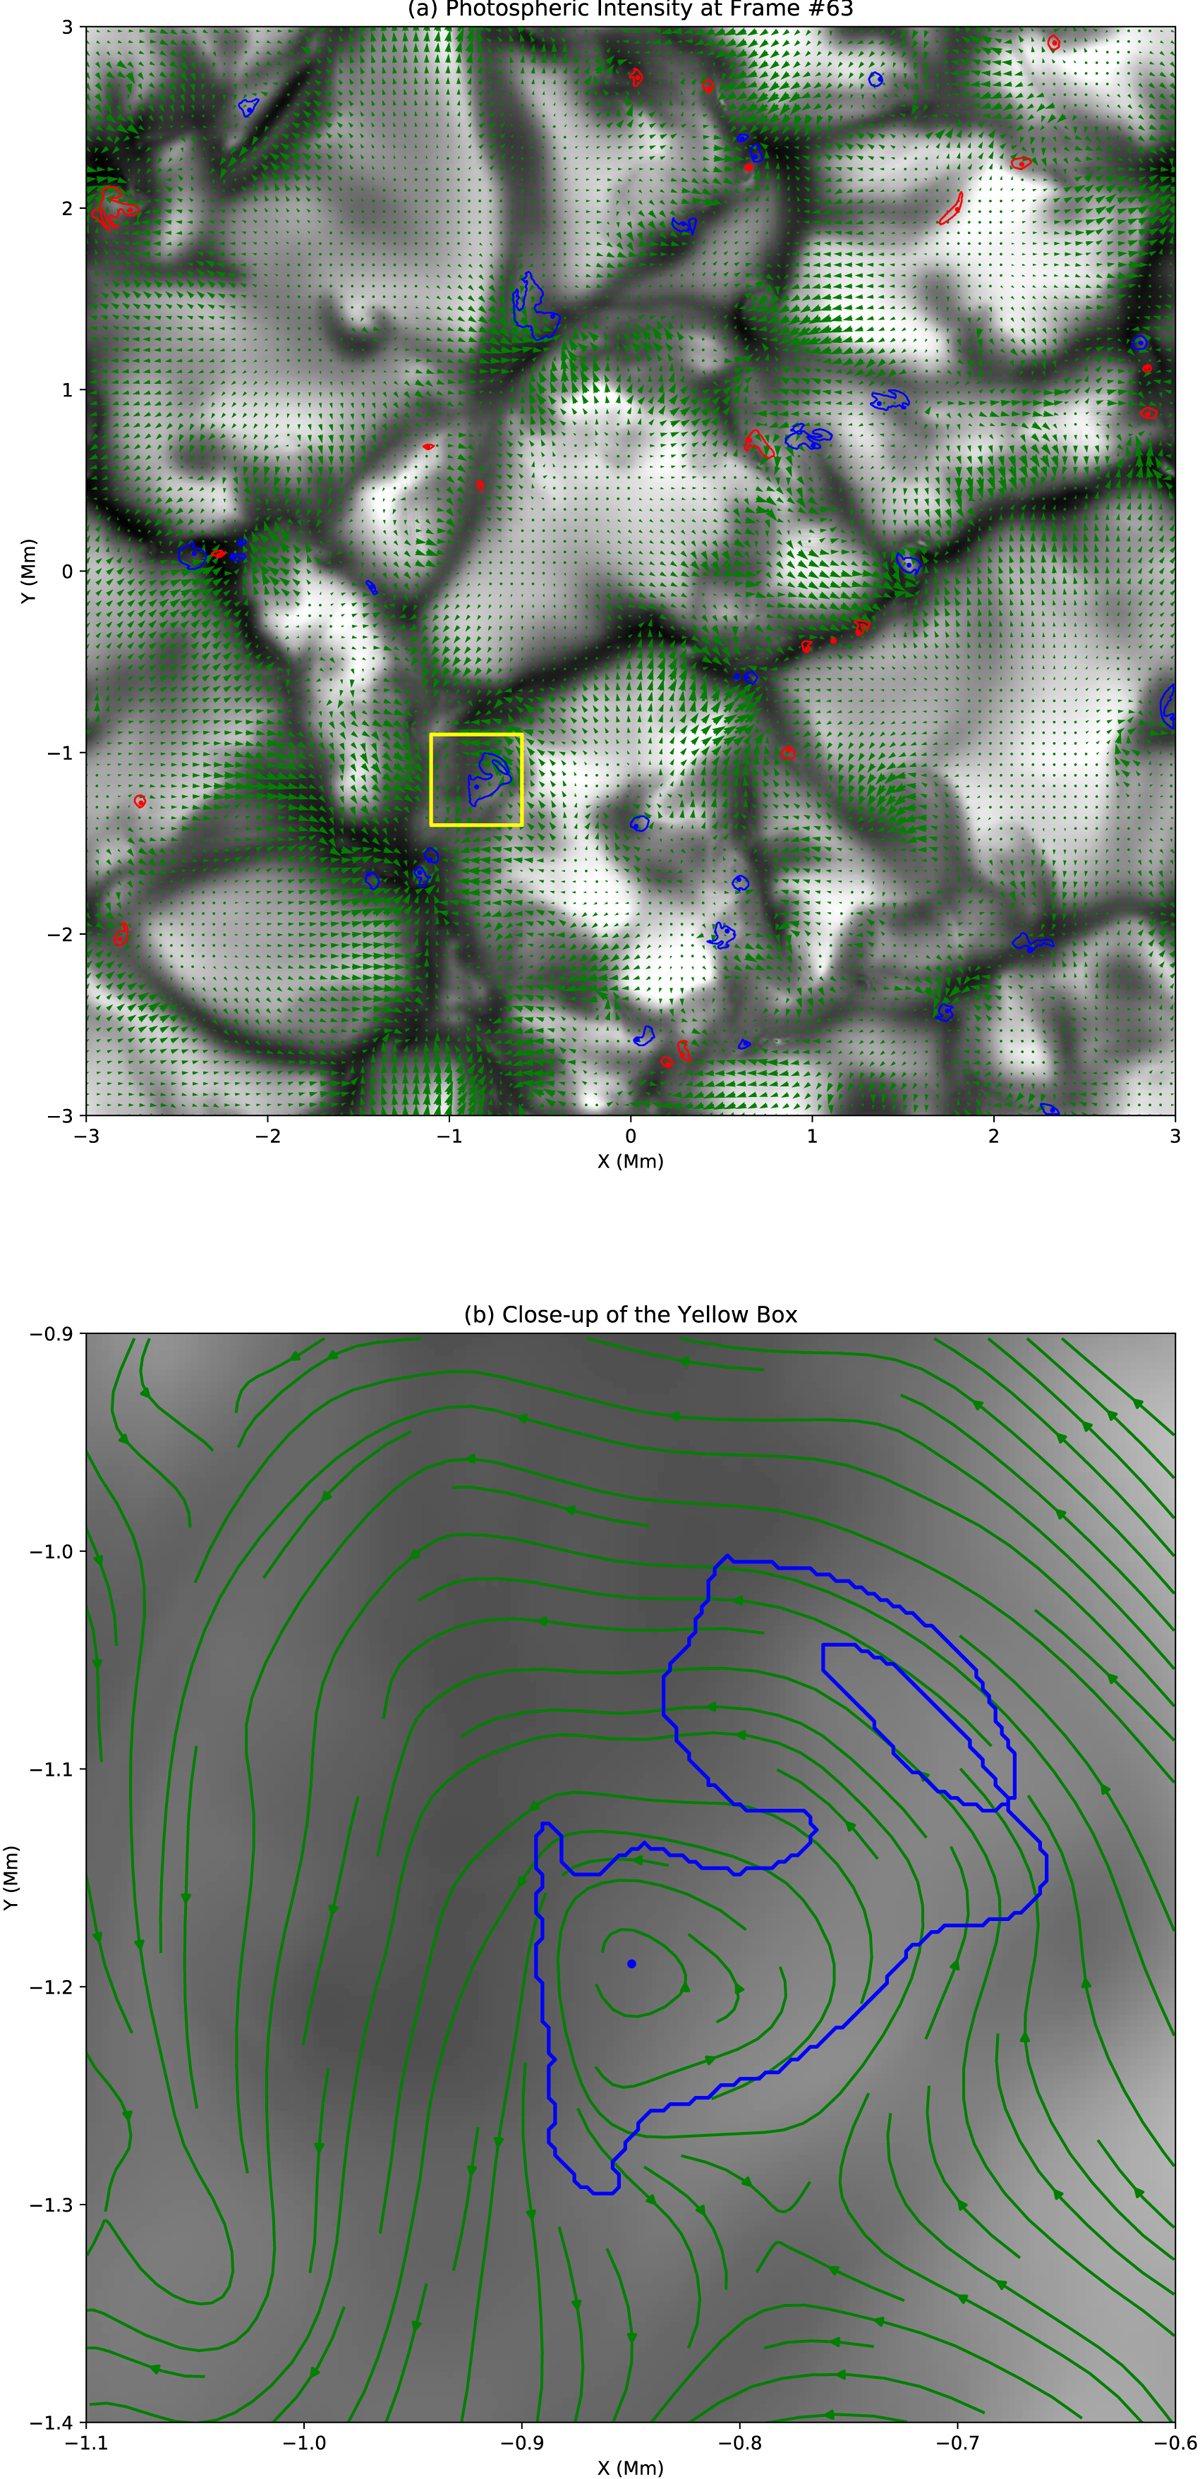
Detected velocity swirls at frame 63. The black-and-white background in panel a represents the photospheric intensity. Green arrows indicate the photospheric horizontal velocity field from the numerical simulation. Blue (red) dots and curves are the centres and edges of the detected velocity swirls with anticlockwise (clockwise) rotations. Panel b: close-up view of the yellow box in panel a.
Current usage metrics show cumulative count of Article Views (full-text article views including HTML views, PDF and ePub downloads, according to the available data) and Abstracts Views on Vision4Press platform.
Data correspond to usage on the plateform after 2015. The current usage metrics is available 48-96 hours after online publication and is updated daily on week days.
Initial download of the metrics may take a while.