Fig. 1.
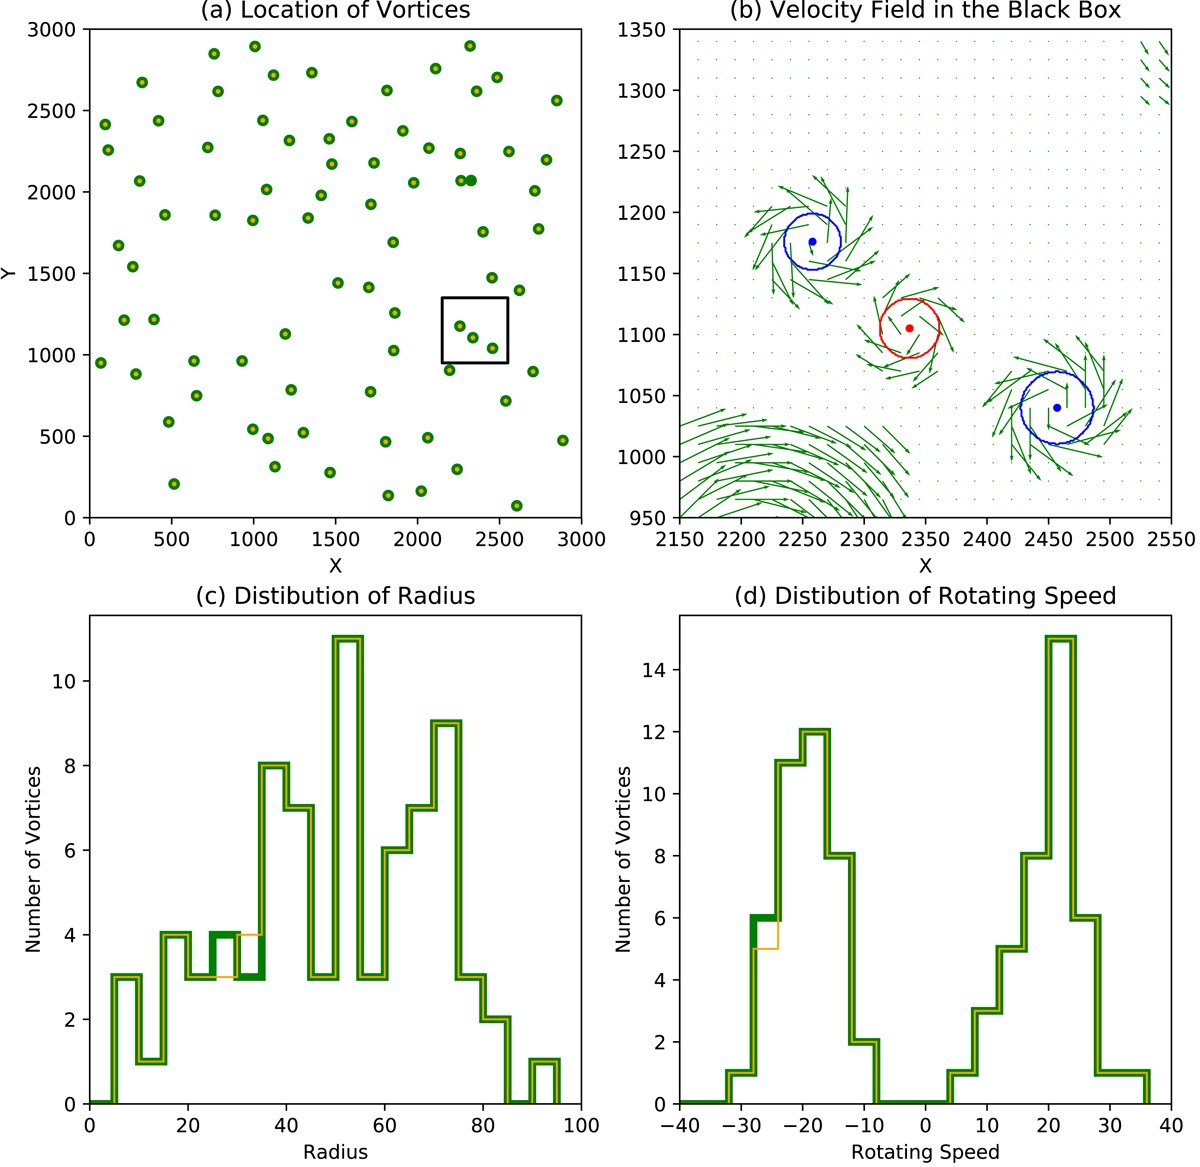
Statistics of the synthetic data and the corresponding vortex detection results by ASDA. Green and yellow dots in panel a are the locations of generated and detected vortices, respectively. Panel b: close-up view of the black box in panel a. Green arrows represent the velocity field. Blue (red) dots and curves are the centres and edges of vortices with anticlockwise (clockwise) rotations. Panels c and d: distributions of the radii and rotating speeds of the generated (green) and detected (yellow) vortices.
Current usage metrics show cumulative count of Article Views (full-text article views including HTML views, PDF and ePub downloads, according to the available data) and Abstracts Views on Vision4Press platform.
Data correspond to usage on the plateform after 2015. The current usage metrics is available 48-96 hours after online publication and is updated daily on week days.
Initial download of the metrics may take a while.