Fig. 2.
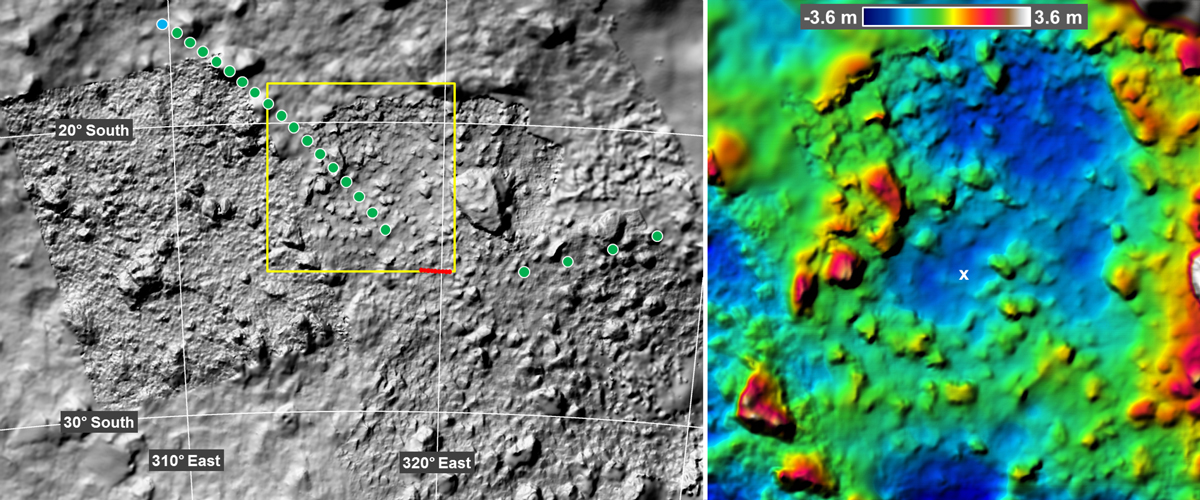
Three-dimensional surface model of the MASCOT landing site area: left: hill-shaded relief of the regional DTM. The colored dots indicate the sub-spacecraft points at the ONC image acquisition times (green: ONC-W1, red: ONC-W2, blue: ONC-T). Right: color-coded DTM subset of the central 50 m × 50 m area (represented by the yellow square in the left-hand image) around MASCOT’s final rest position (marked by the white cross). For display in this figure, heights were reduced from spherical radii with respect to Ryugu’s mean radius to heights above a plane that represents the mean surface slope in this area (about 13° tilted with respect to the spherical tangent).
Current usage metrics show cumulative count of Article Views (full-text article views including HTML views, PDF and ePub downloads, according to the available data) and Abstracts Views on Vision4Press platform.
Data correspond to usage on the plateform after 2015. The current usage metrics is available 48-96 hours after online publication and is updated daily on week days.
Initial download of the metrics may take a while.