Free Access
Fig. 6.
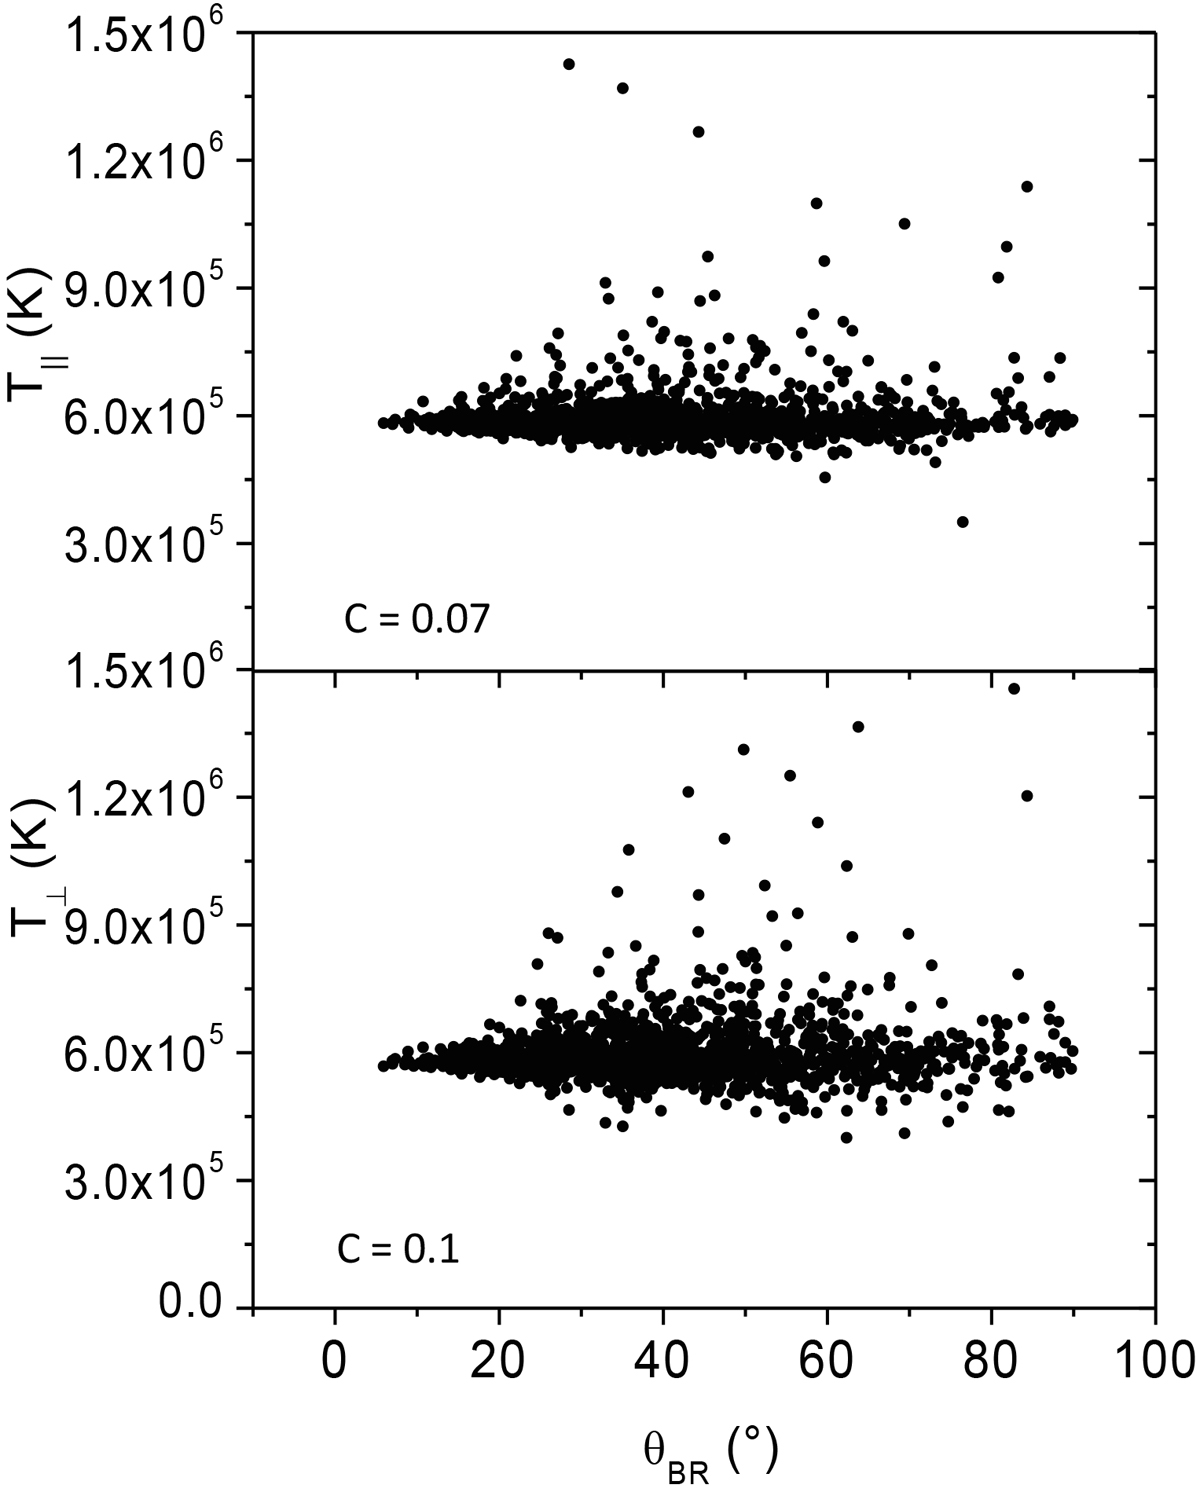
Scatter plots of θBR vs. T∥ (upper panel) and θBR vs. T⊥ (lower panel) as derived by numerical simulations reproducing the acquisition of an electrostatic analyzer. Correlation coefficients between T components and θBR are indicated in the two panels.
Current usage metrics show cumulative count of Article Views (full-text article views including HTML views, PDF and ePub downloads, according to the available data) and Abstracts Views on Vision4Press platform.
Data correspond to usage on the plateform after 2015. The current usage metrics is available 48-96 hours after online publication and is updated daily on week days.
Initial download of the metrics may take a while.