Fig. 5.
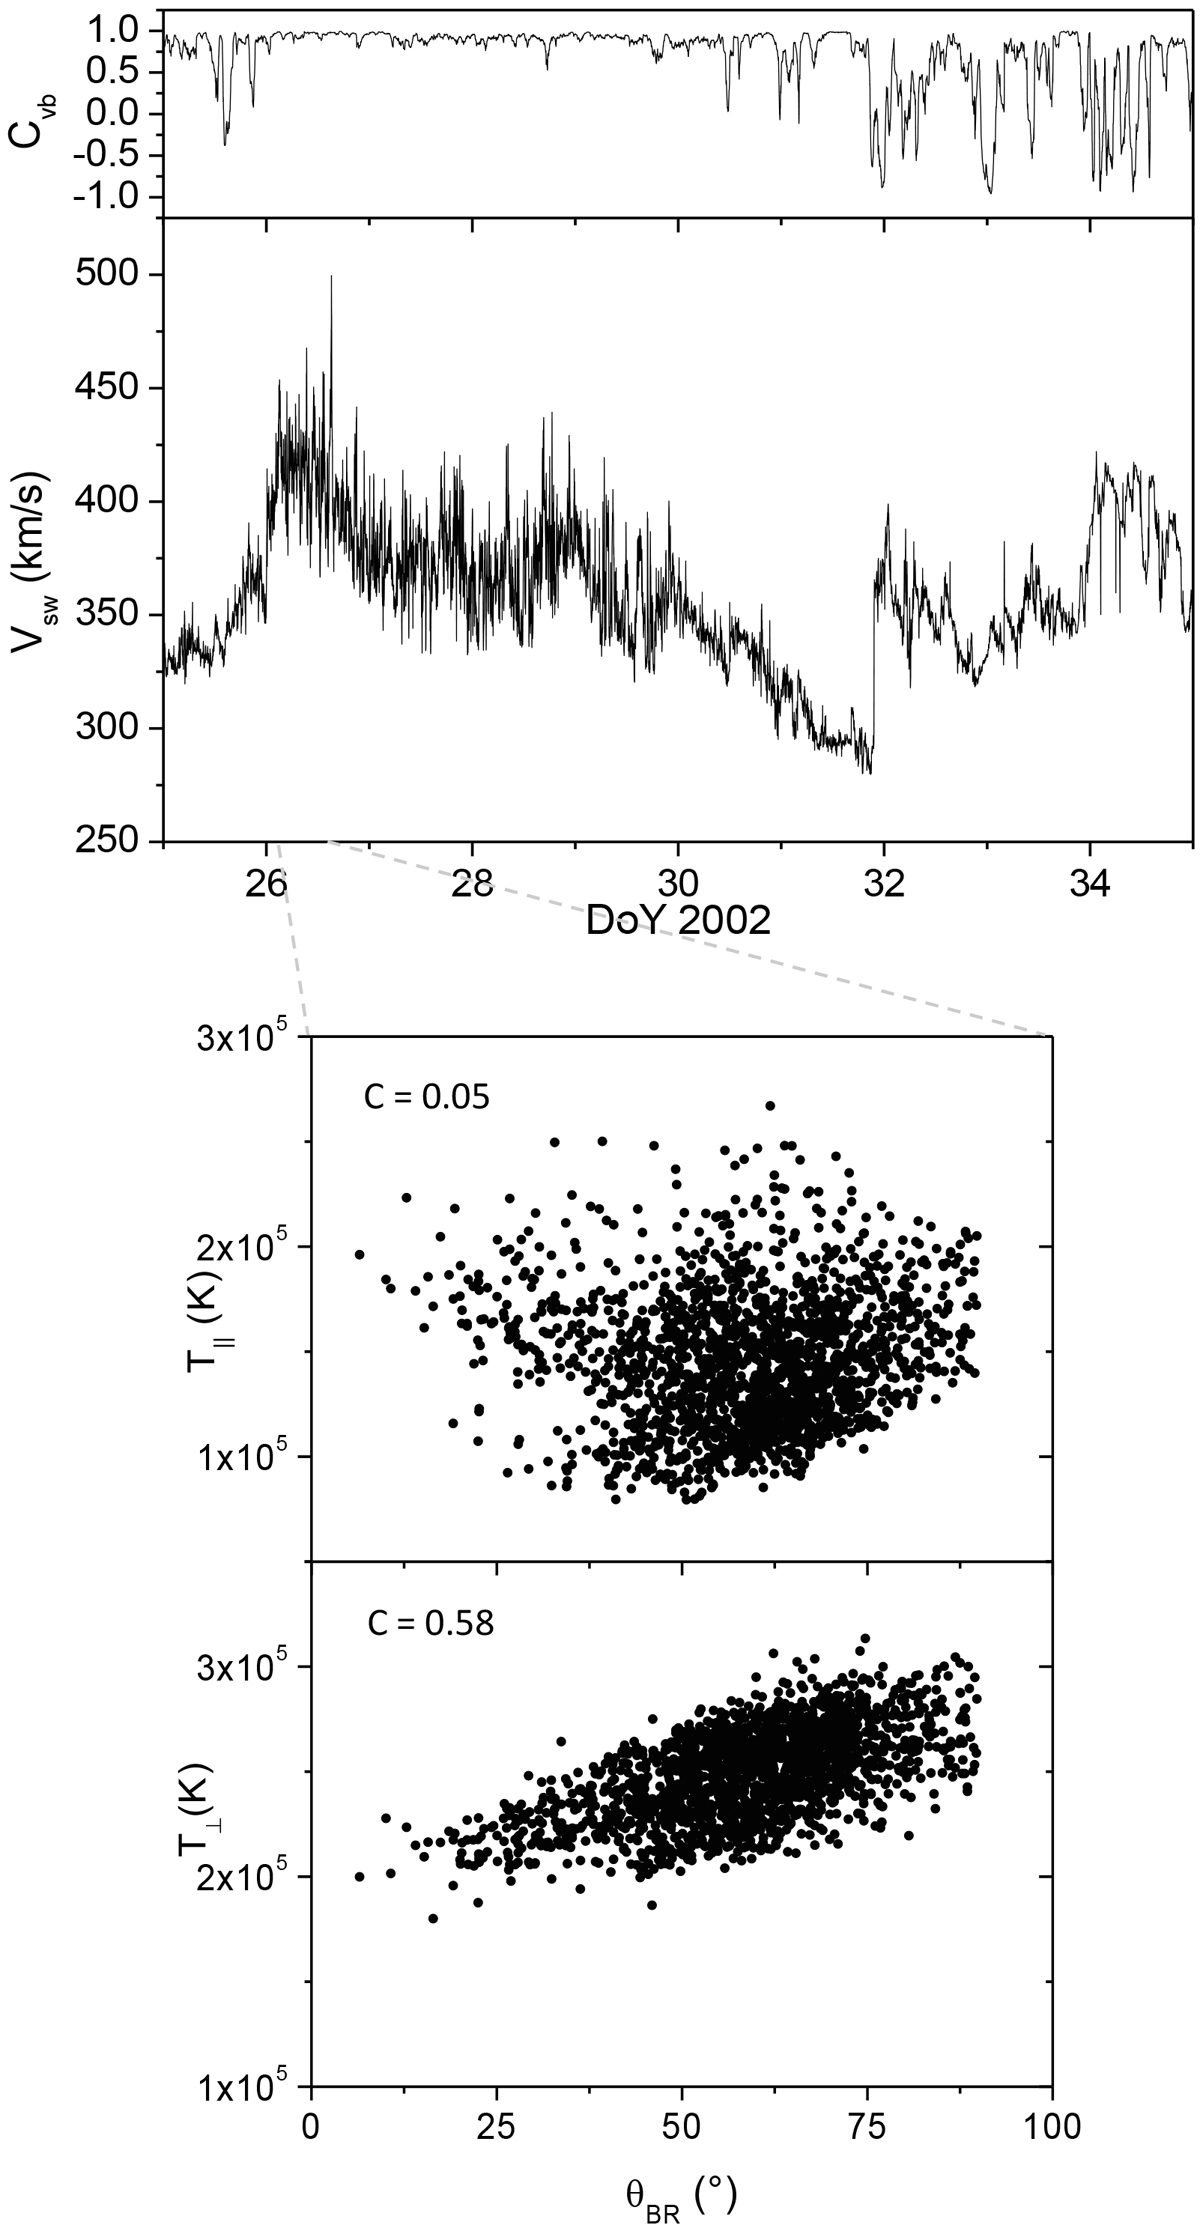
Wind at 1 AU. Upper panels: bulk speed Vsw (lower plot) and correlation coefficient at 1 h scale Cvb (upper plot). The dashed red box marks the main portion of the Alfvénic slow wind stream. Lower panels: zoom of the time interval showing the scatter plots of θBR vs. T∥ (upper panel) and θBR vs. T⊥ (lower panel). The panels also show the value of the linear correlation coefficient between T components and θBR.
Current usage metrics show cumulative count of Article Views (full-text article views including HTML views, PDF and ePub downloads, according to the available data) and Abstracts Views on Vision4Press platform.
Data correspond to usage on the plateform after 2015. The current usage metrics is available 48-96 hours after online publication and is updated daily on week days.
Initial download of the metrics may take a while.