Free Access
Fig. 4.
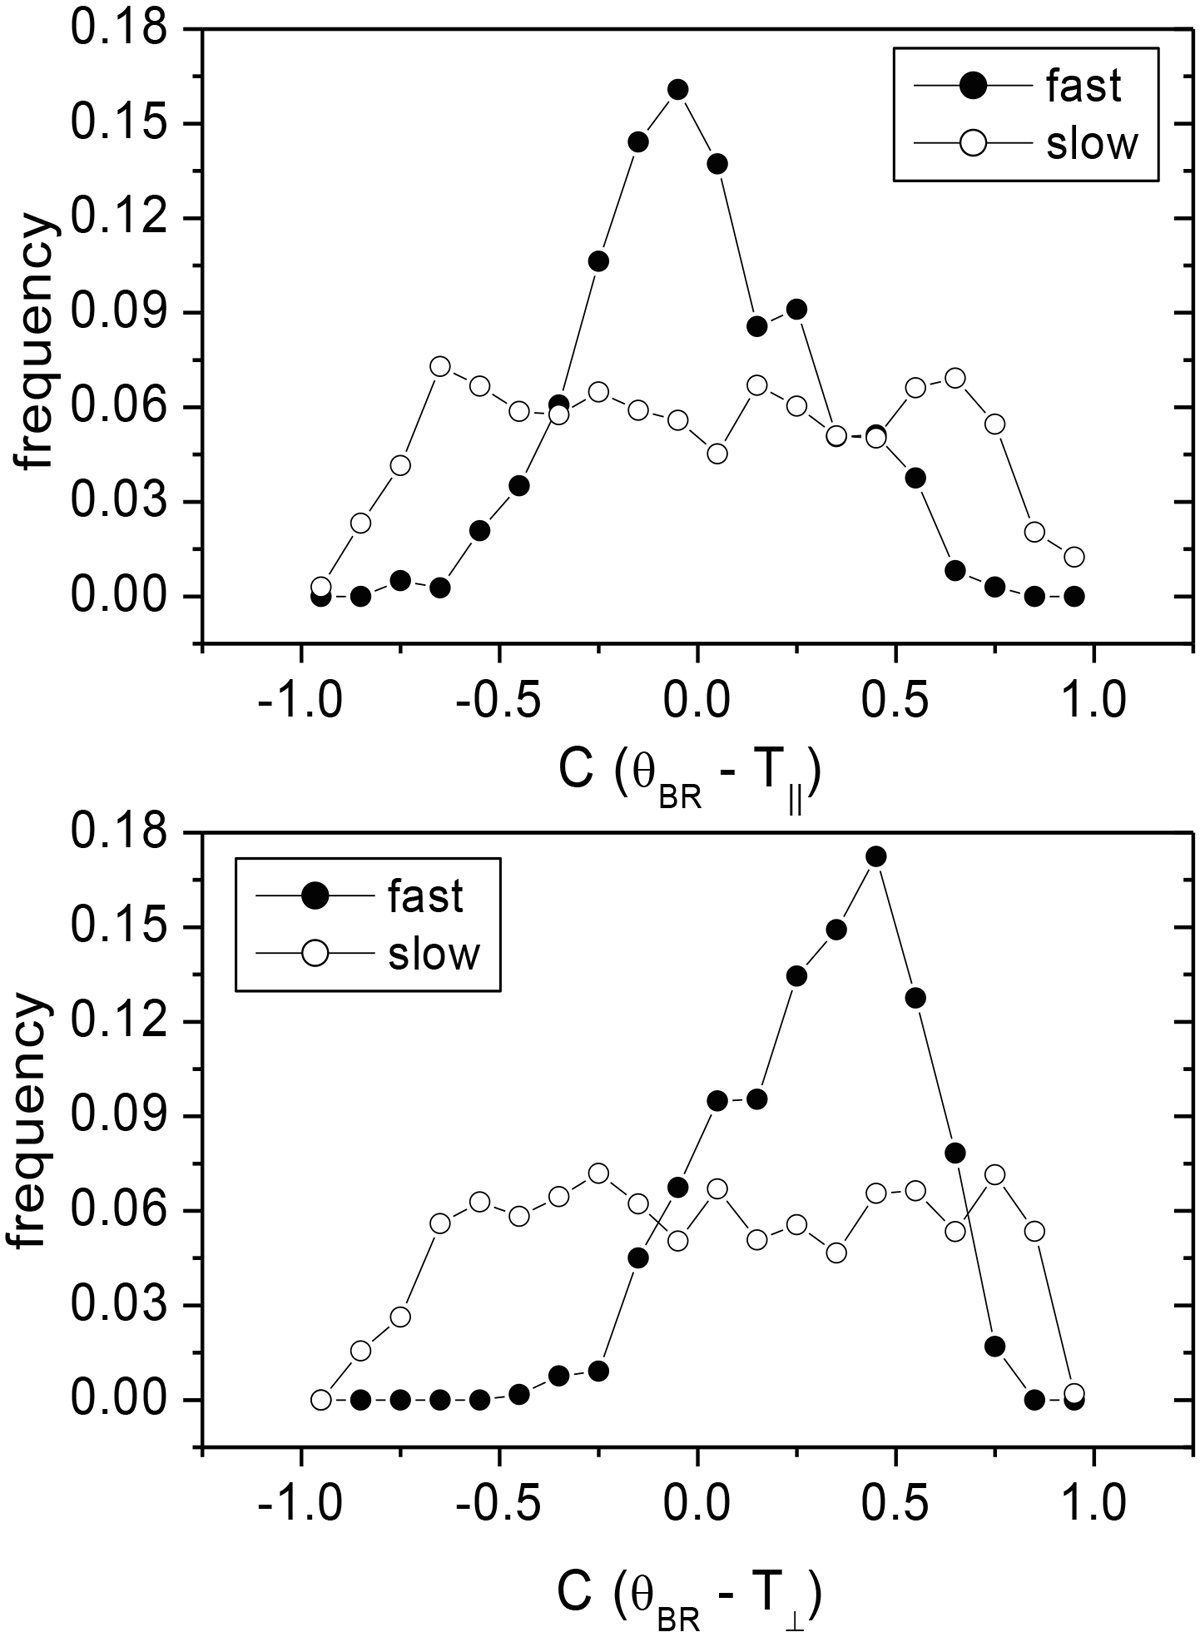
Wind at 1 AU. Frequency counts normalized to the total number of cases of the correlation coefficient between θBR and T∥ (upper panel) and between θBR and T⊥ (lower panel) for fast wind (black circles) and slow wind (empty circles). The time intervals used to compute the histograms are indicated in the text.
Current usage metrics show cumulative count of Article Views (full-text article views including HTML views, PDF and ePub downloads, according to the available data) and Abstracts Views on Vision4Press platform.
Data correspond to usage on the plateform after 2015. The current usage metrics is available 48-96 hours after online publication and is updated daily on week days.
Initial download of the metrics may take a while.