Free Access
Fig. 3.
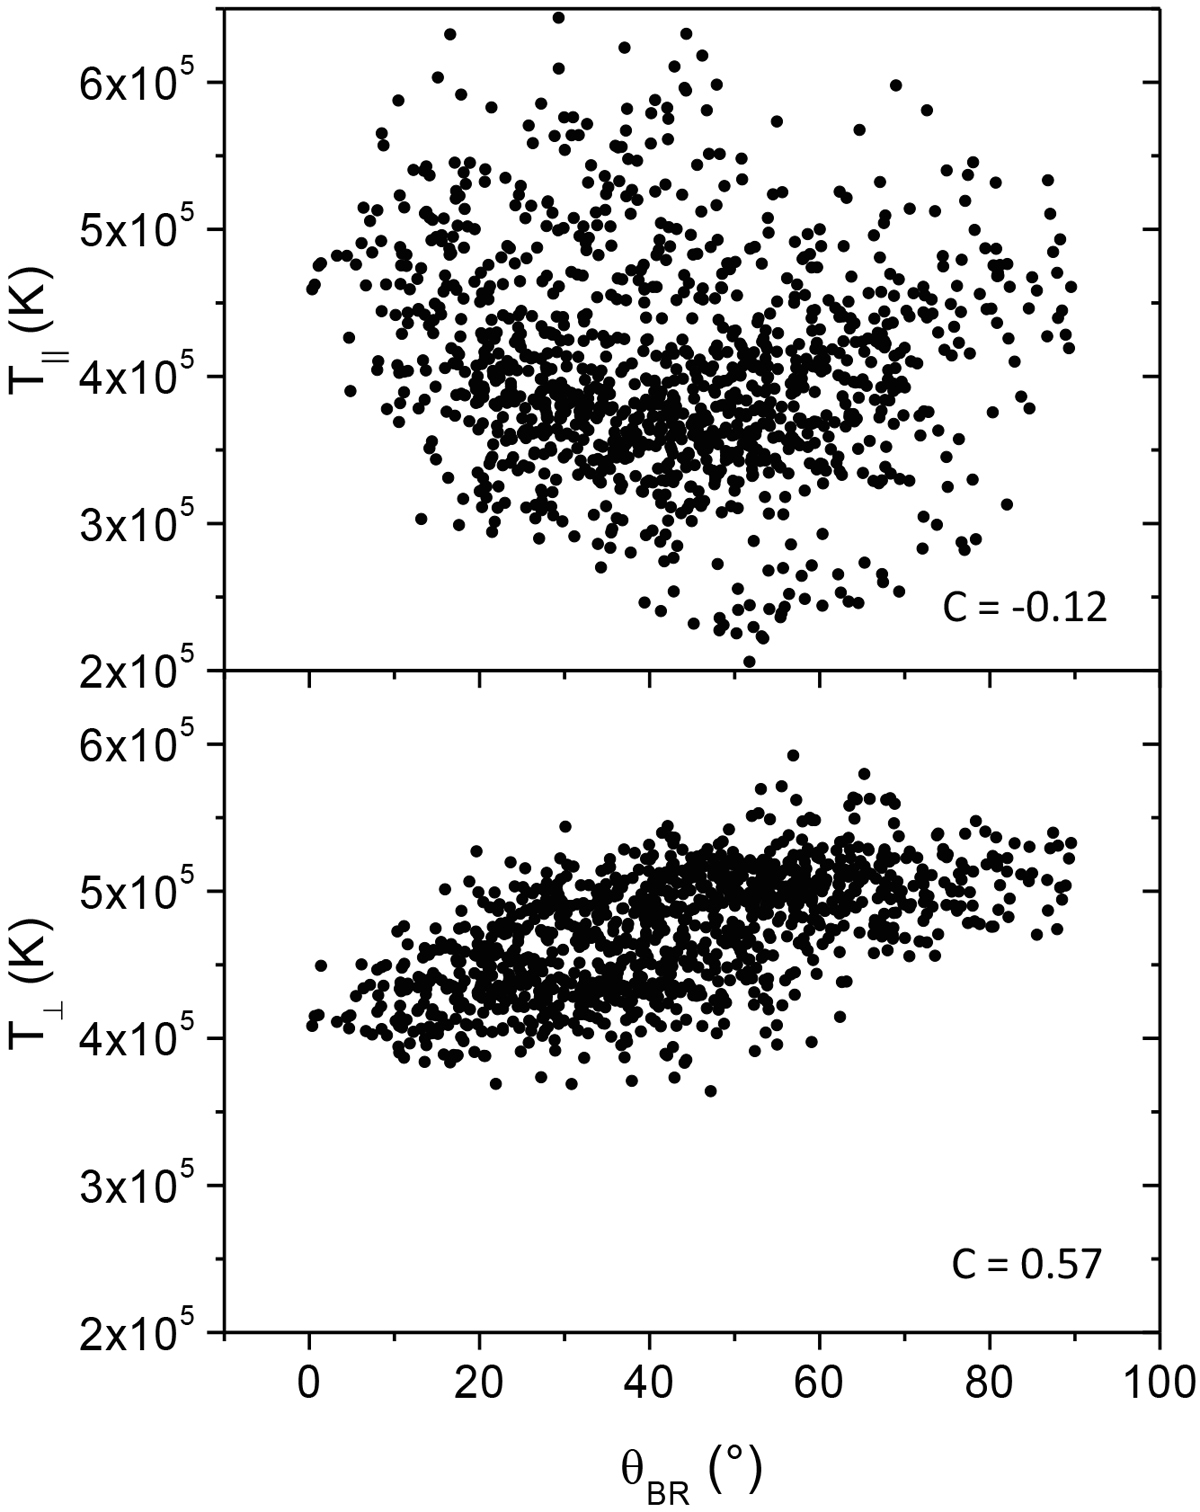
Wind at 1 AU. Upper panel: θBR vs. T∥. Lower panel: θBR vs. T⊥. Results are shown for the interval of fast wind shown in Fig. 2. Each panel also reports the value of the linear correlation coefficient between T components and θBR in that interval.
Current usage metrics show cumulative count of Article Views (full-text article views including HTML views, PDF and ePub downloads, according to the available data) and Abstracts Views on Vision4Press platform.
Data correspond to usage on the plateform after 2015. The current usage metrics is available 48-96 hours after online publication and is updated daily on week days.
Initial download of the metrics may take a while.