Fig. 2.
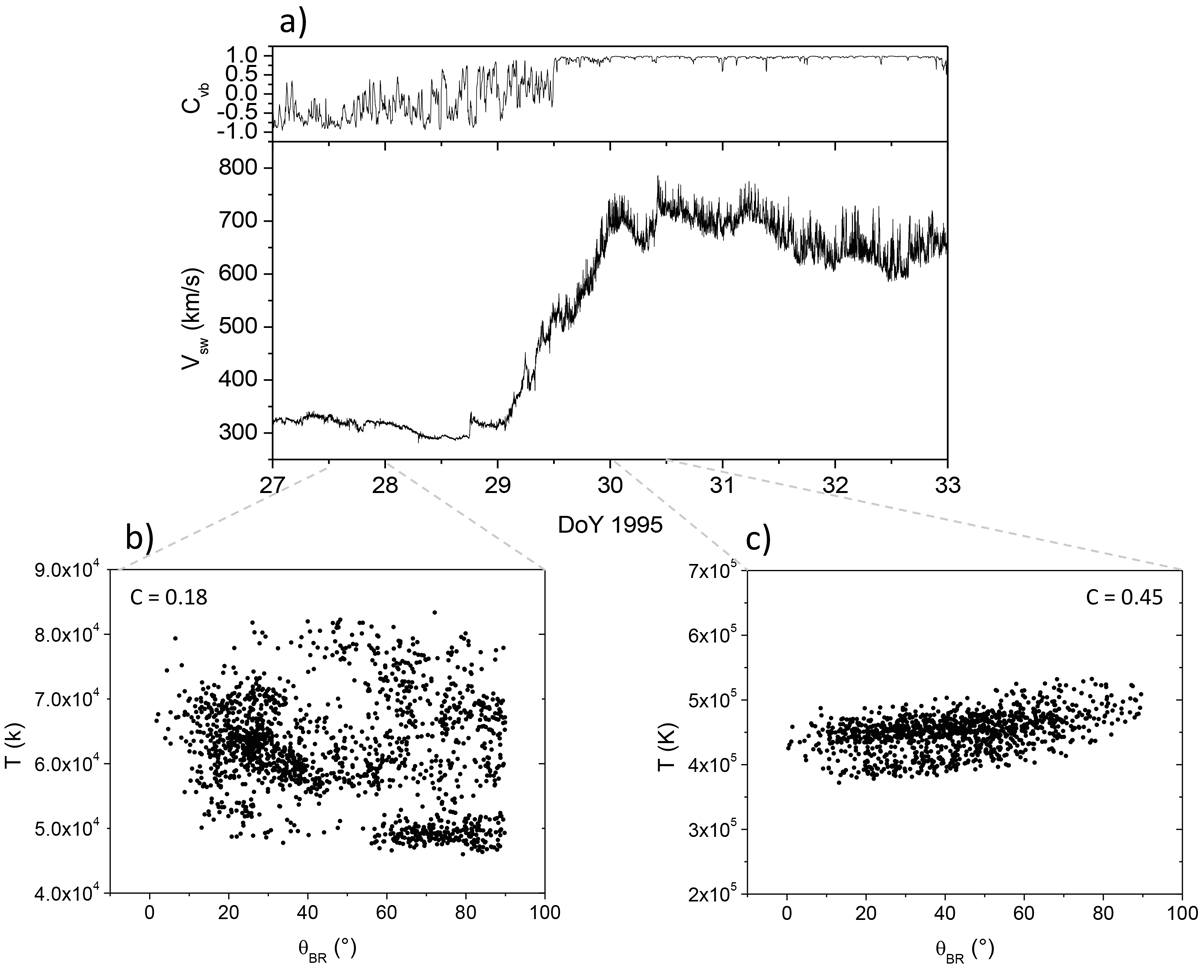
Wind at 1 AU. Panel a: bulk speed, Vsw (lower plot) and v − b correlation coefficient at 1 h scale, Cvb (upper plot); panels b and c: scatter plots of T and θBR for an interval of slow (left) and fast wind (right), respectively, along with the value of the linear correlation coefficient between T and θBR (indicated as C) in the zoomed-in time interval.
Current usage metrics show cumulative count of Article Views (full-text article views including HTML views, PDF and ePub downloads, according to the available data) and Abstracts Views on Vision4Press platform.
Data correspond to usage on the plateform after 2015. The current usage metrics is available 48-96 hours after online publication and is updated daily on week days.
Initial download of the metrics may take a while.