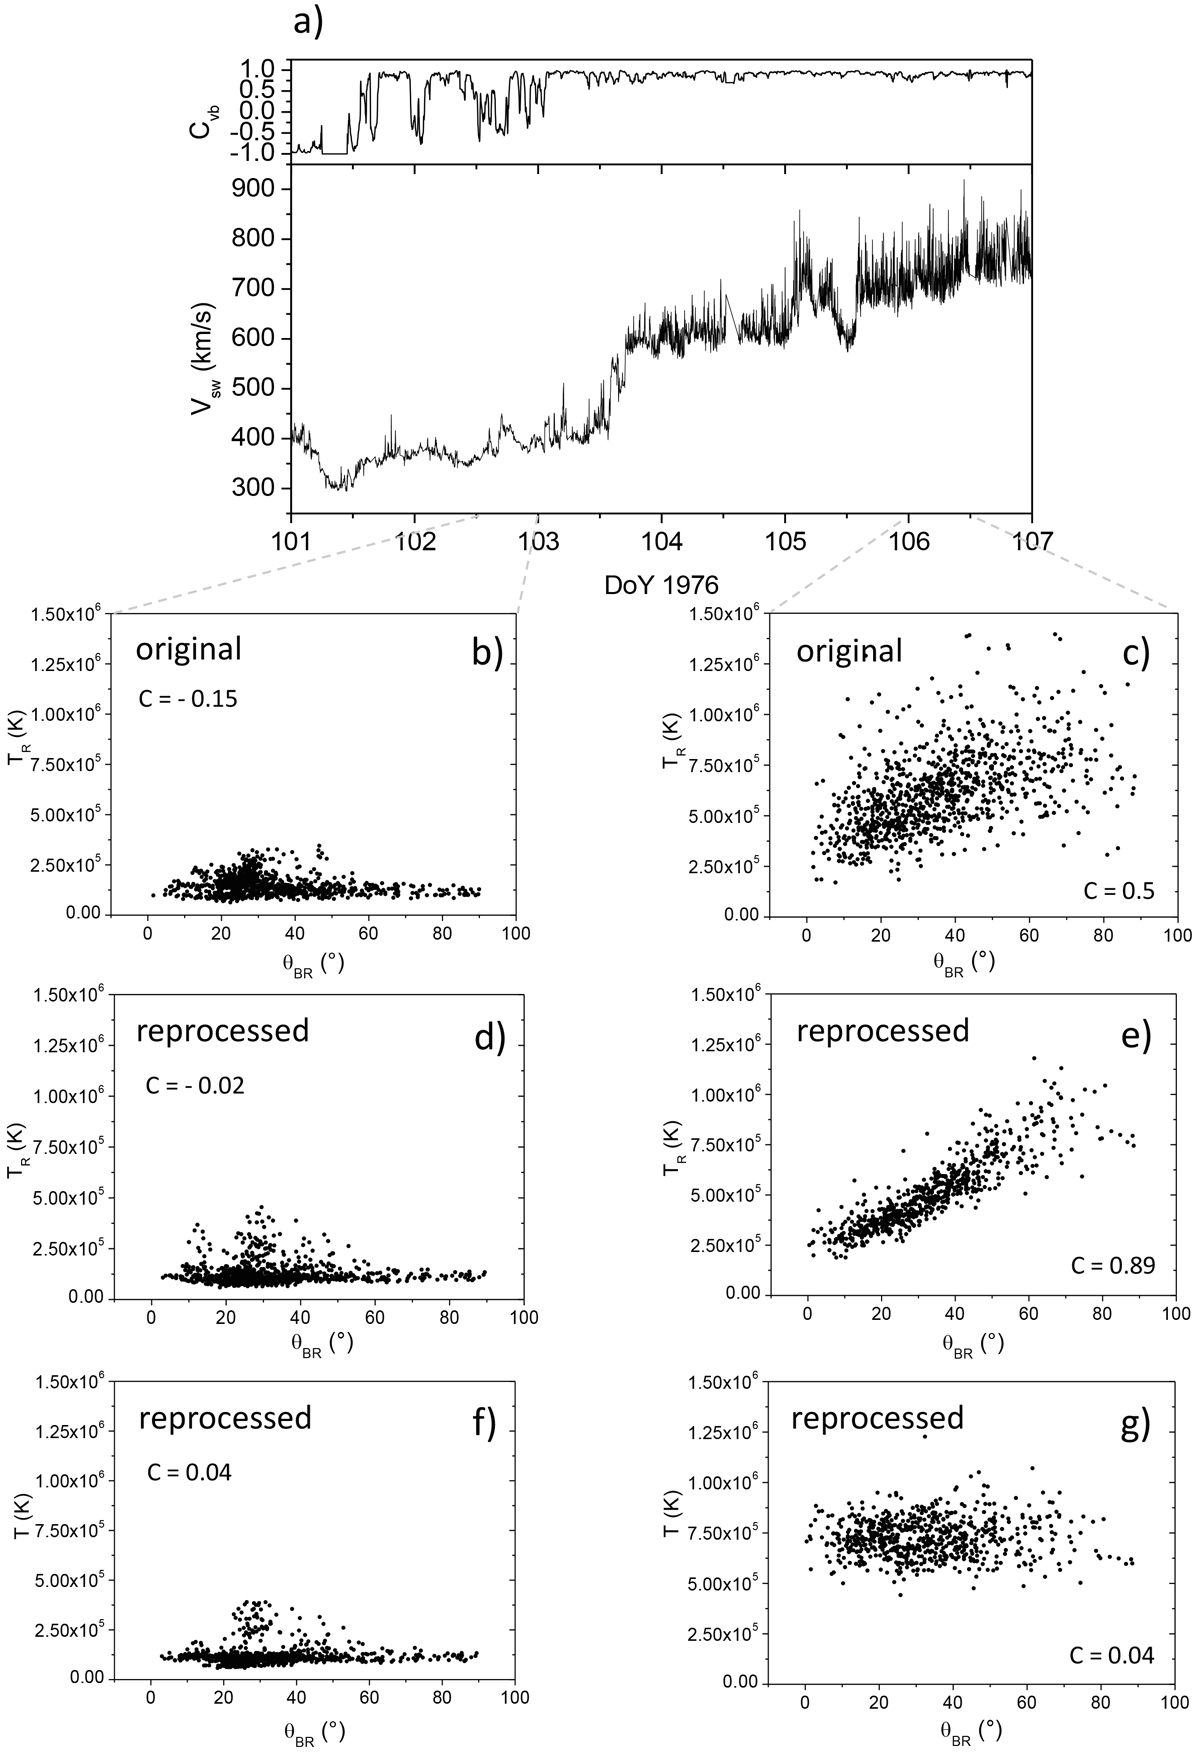
Fig. 1.
Helios 2 at 0.3 AU. Panel a: bulk speed, Vsw (lower plot), and the v − b correlation coefficient at 1 h scale, Cvb (upper plot). Panels b and c: scatter plots of TR (as derived with Eq. (1)) and θBR for an interval of slow wind (left) and fast wind (right), respectively, using data from NASA website CDAWeb (https://cdaweb.sci.gsfc.nasa.gov), indicated as original. Panels d and e: analogous to panels b and c, respectively, for data from the Space Sciences Laboratory University of California (Berkeley) dataset (http://helios-data.ssl.berkeley.edu/data/), indicated as reprocessed. We show also the scatter plots of the total temperature T vs. θBR referring to reprocessed data in panels f and g. Panels b–g: we report also the value of the linear correlation coefficient, C, between TR (or T) and θBR, in the zoomed time intervals.
Current usage metrics show cumulative count of Article Views (full-text article views including HTML views, PDF and ePub downloads, according to the available data) and Abstracts Views on Vision4Press platform.
Data correspond to usage on the plateform after 2015. The current usage metrics is available 48-96 hours after online publication and is updated daily on week days.
Initial download of the metrics may take a while.