Free Access
Fig. 4.
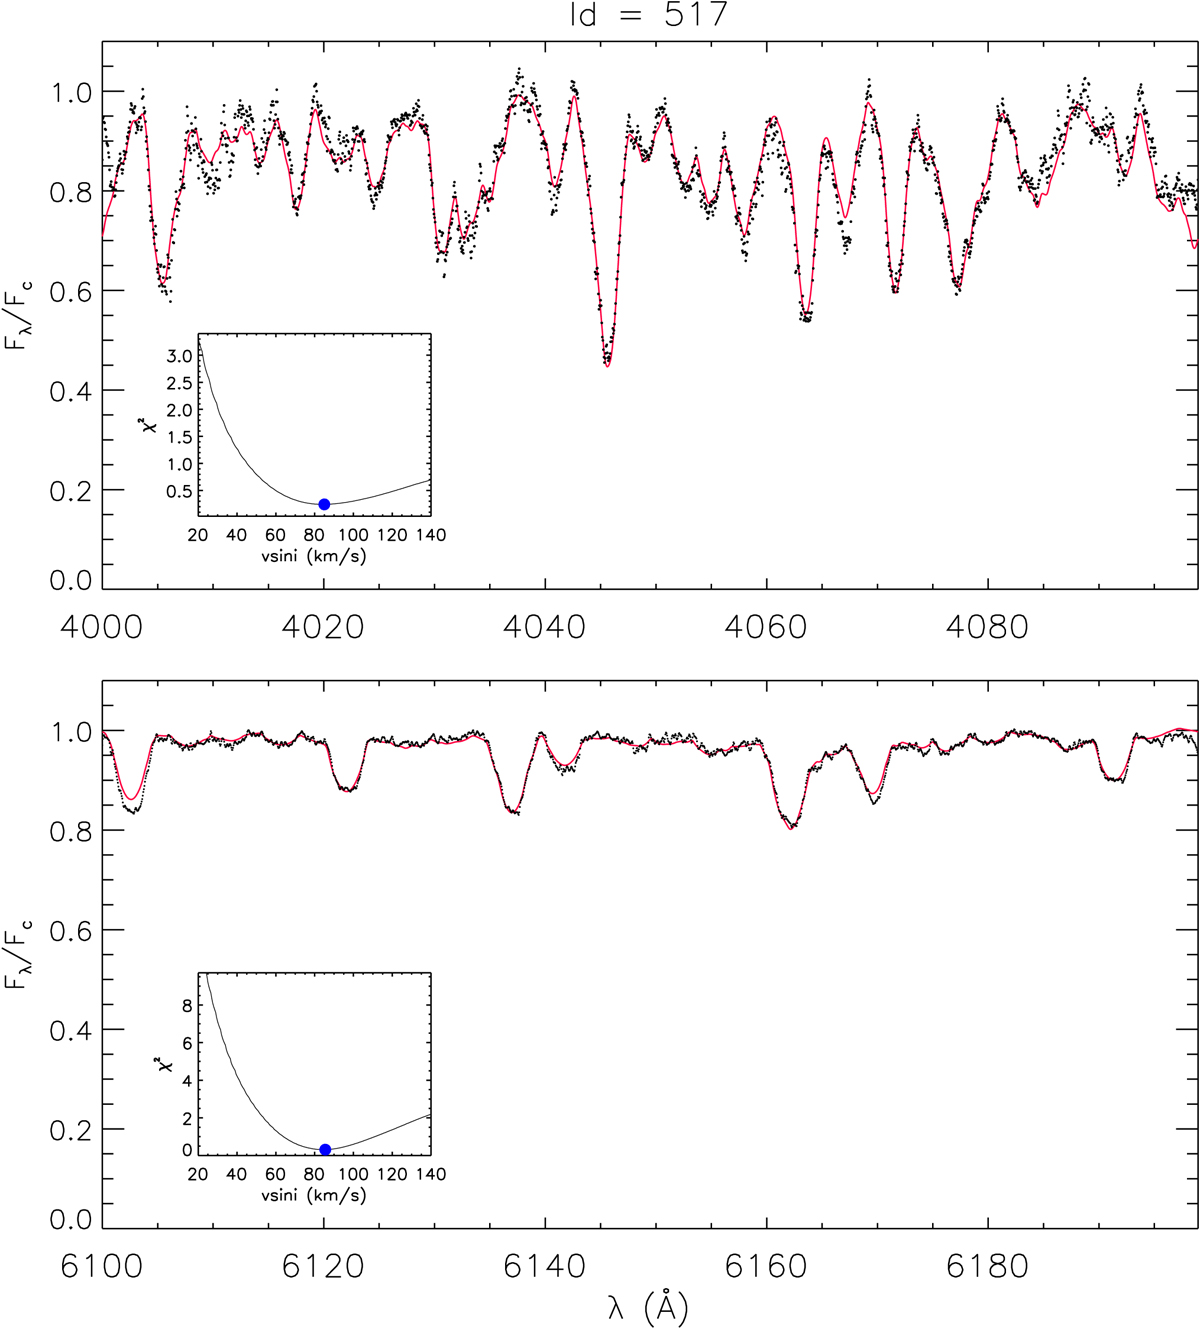
Observed HARPS-N spectrum of S 517 (black dots) in the λ 4000 Å (upper panel) and λ 6100 Å (lower panel) spectral regions. In each panel the template spectrum broadened at the v sin i of the target is overplotted with a full red line. The insets show the χ2 of the fit as a function of the v sin i.
Current usage metrics show cumulative count of Article Views (full-text article views including HTML views, PDF and ePub downloads, according to the available data) and Abstracts Views on Vision4Press platform.
Data correspond to usage on the plateform after 2015. The current usage metrics is available 48-96 hours after online publication and is updated daily on week days.
Initial download of the metrics may take a while.