Fig. 3.
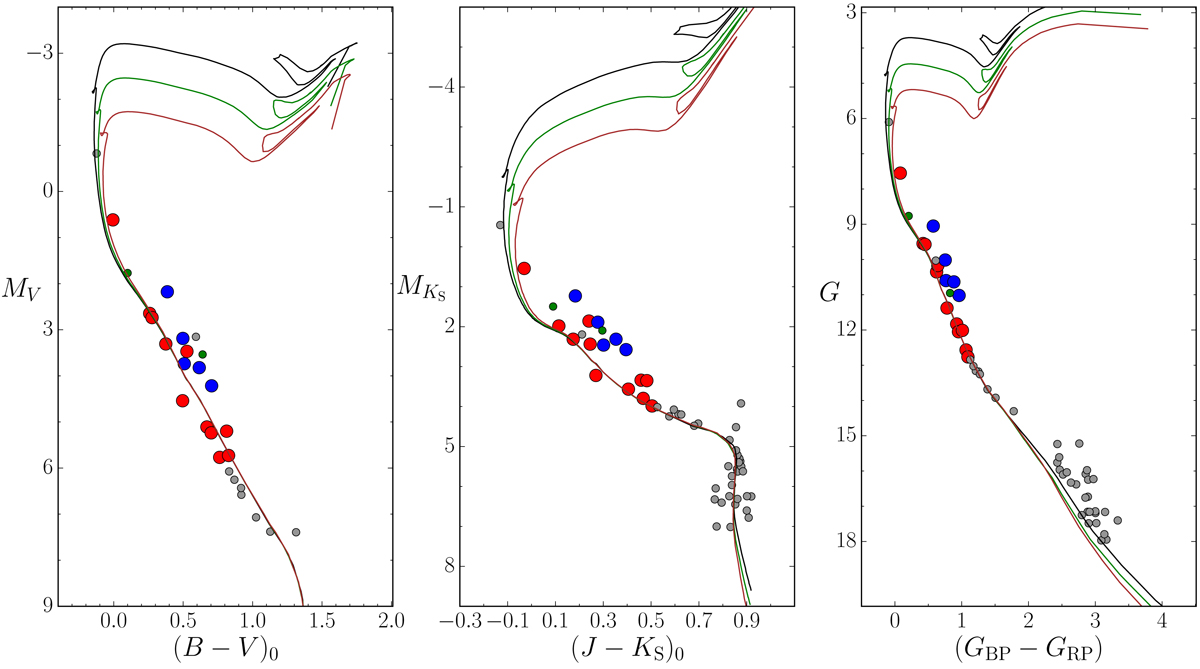
Color-magnitude diagrams for likely members of ASCC 123 in three different photometric systems: left: MV/(B − V)0 from the APASS catalog; center: MKs/(J − Ks)0 (2MASS photometry); right:G/(GBP − GRP) (Gaia DR2 data). Photometric data for likely members appear as small gray dots. Stars observed spectroscopically are represented as large red dots (single or possible SB1 objects) or blue dots (SB2). The solid lines represent the best-fitting PARSEC isochrones computed at τ = 100 Myr (black line), τ = 155 Myr (green line), and τ = 250 Myr (red line) assuming the metallicity and extinction found in the present work and the distance d = 233 pc (Cantat-Gaudin et al. 2018).
Current usage metrics show cumulative count of Article Views (full-text article views including HTML views, PDF and ePub downloads, according to the available data) and Abstracts Views on Vision4Press platform.
Data correspond to usage on the plateform after 2015. The current usage metrics is available 48-96 hours after online publication and is updated daily on week days.
Initial download of the metrics may take a while.