Fig. 6.
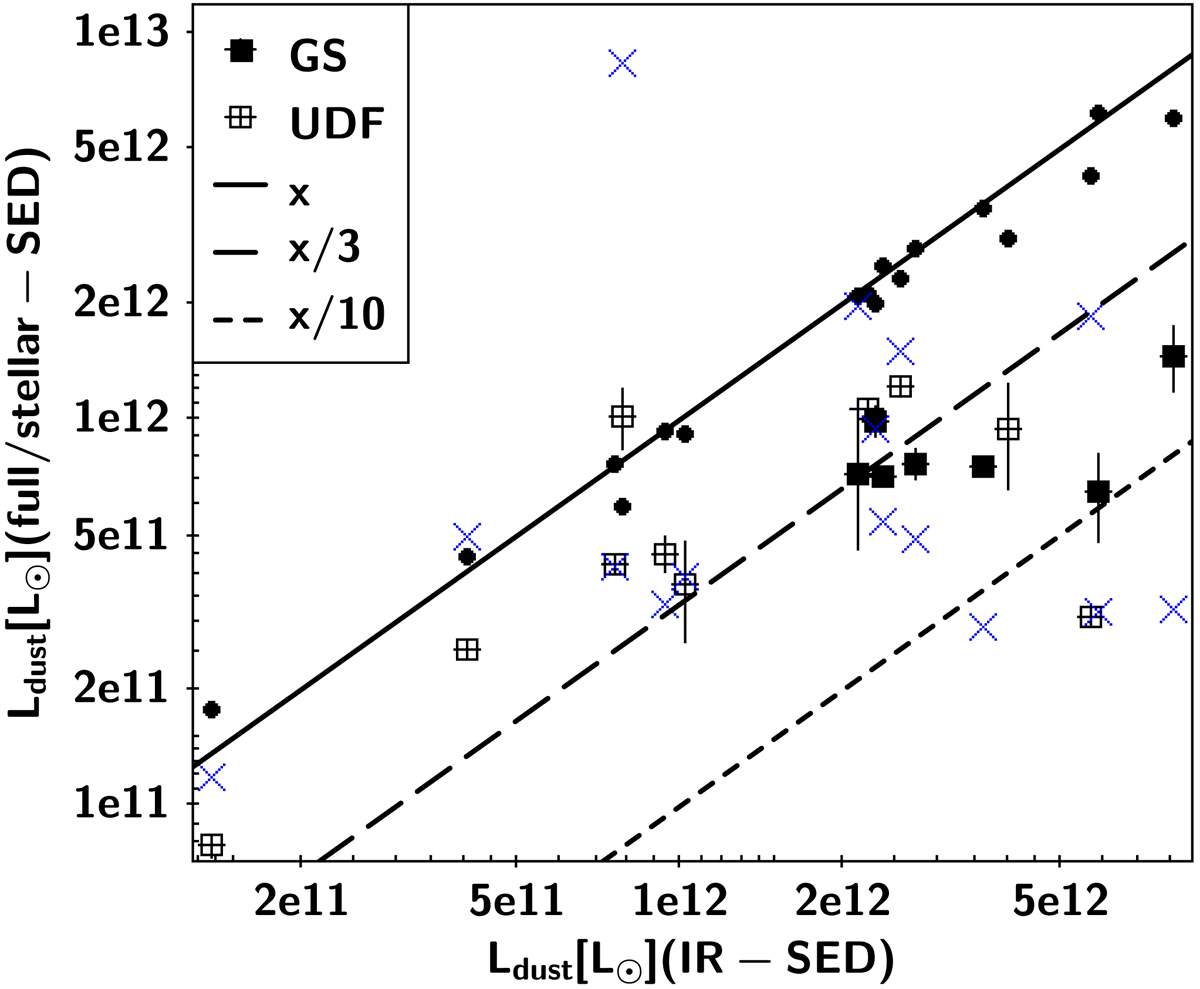
Comparison between Ldust measured with the fit of the IR data only (MIPS to ALMA, x-axis), with the fit of the full SED (dots, y-axis), and with the fit of the stellar continuum only (filled squares for GS galaxies and empty squares for UDF galaxies, y-axis). The 1σ errors given by CIGALE for the fit of the stellar continuum are plotted as vertical and horizontal lines. The blue crosses correspond to Ldust values obtained with the slope of the UV continuum. The solid line represents equal quantities on both axes, and dashed and dotted lines represent a Ldust respectively three and ten times lower on the y-axis.
Current usage metrics show cumulative count of Article Views (full-text article views including HTML views, PDF and ePub downloads, according to the available data) and Abstracts Views on Vision4Press platform.
Data correspond to usage on the plateform after 2015. The current usage metrics is available 48-96 hours after online publication and is updated daily on week days.
Initial download of the metrics may take a while.