Fig. 2.
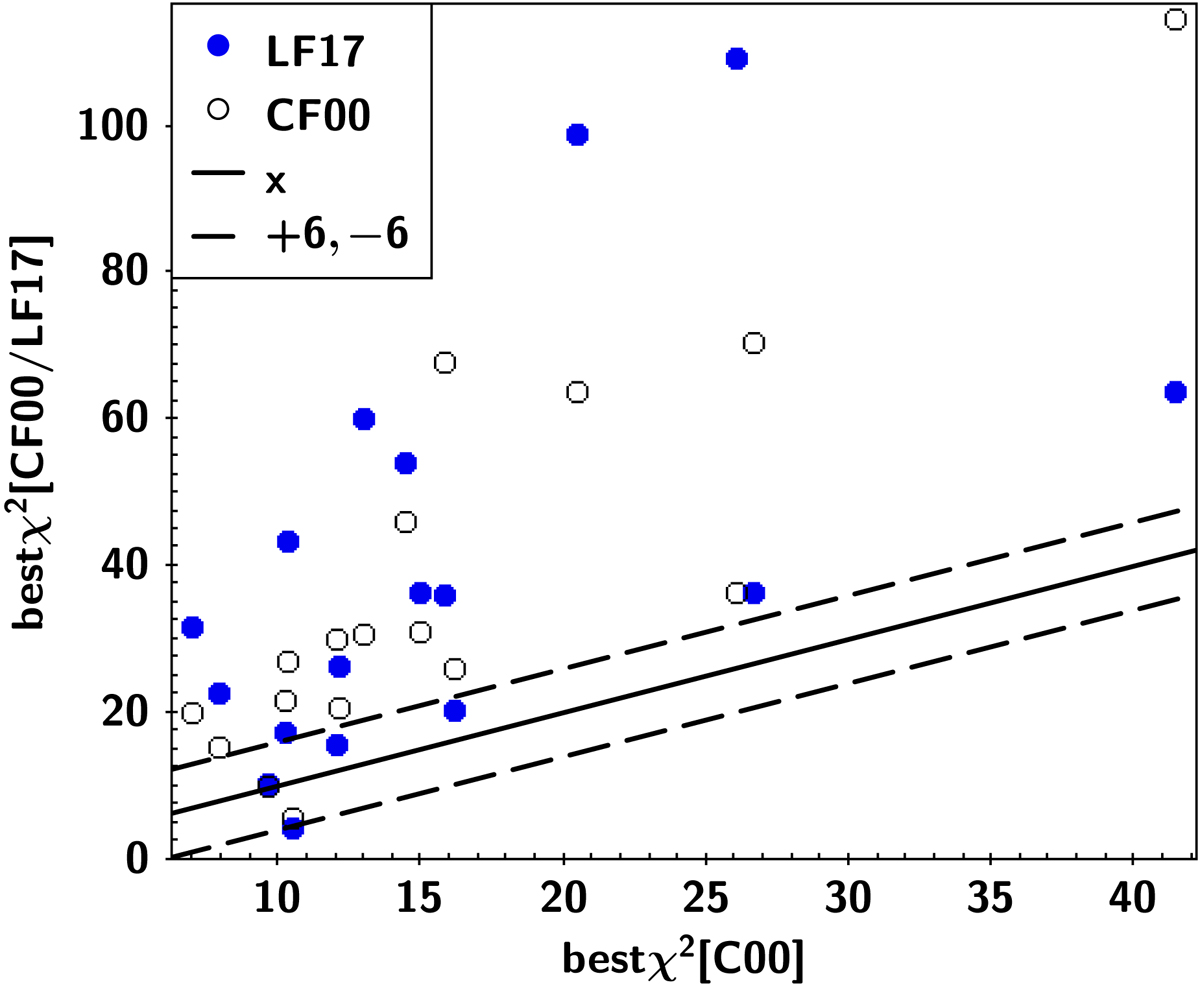
Comparison between best χ2 obtained with each of the three attenuation laws when only the stellar continuum is fitted. The values for C00 are plotted on the x-axis against the values for CF00 (empty circles) and LF17 (blue filled circles) on the y-axis. The solid line represents the 1:1 relation and the dashed lines correspond to |ΔBIC| = 6.
Current usage metrics show cumulative count of Article Views (full-text article views including HTML views, PDF and ePub downloads, according to the available data) and Abstracts Views on Vision4Press platform.
Data correspond to usage on the plateform after 2015. The current usage metrics is available 48-96 hours after online publication and is updated daily on week days.
Initial download of the metrics may take a while.